We have recently updated our Availability Risk Model. Our previous article was a high level introduction to managing the risk of downtime. With the proliferation of microservices and SaaS offerings, many are blind to some key risk drivers.
In our updated model, we have added:
- component level availability,
- component to component communications,
- disaster recovery capabilities
With these additional drivers, we will introduce each concept. Then we will unveil the full model.
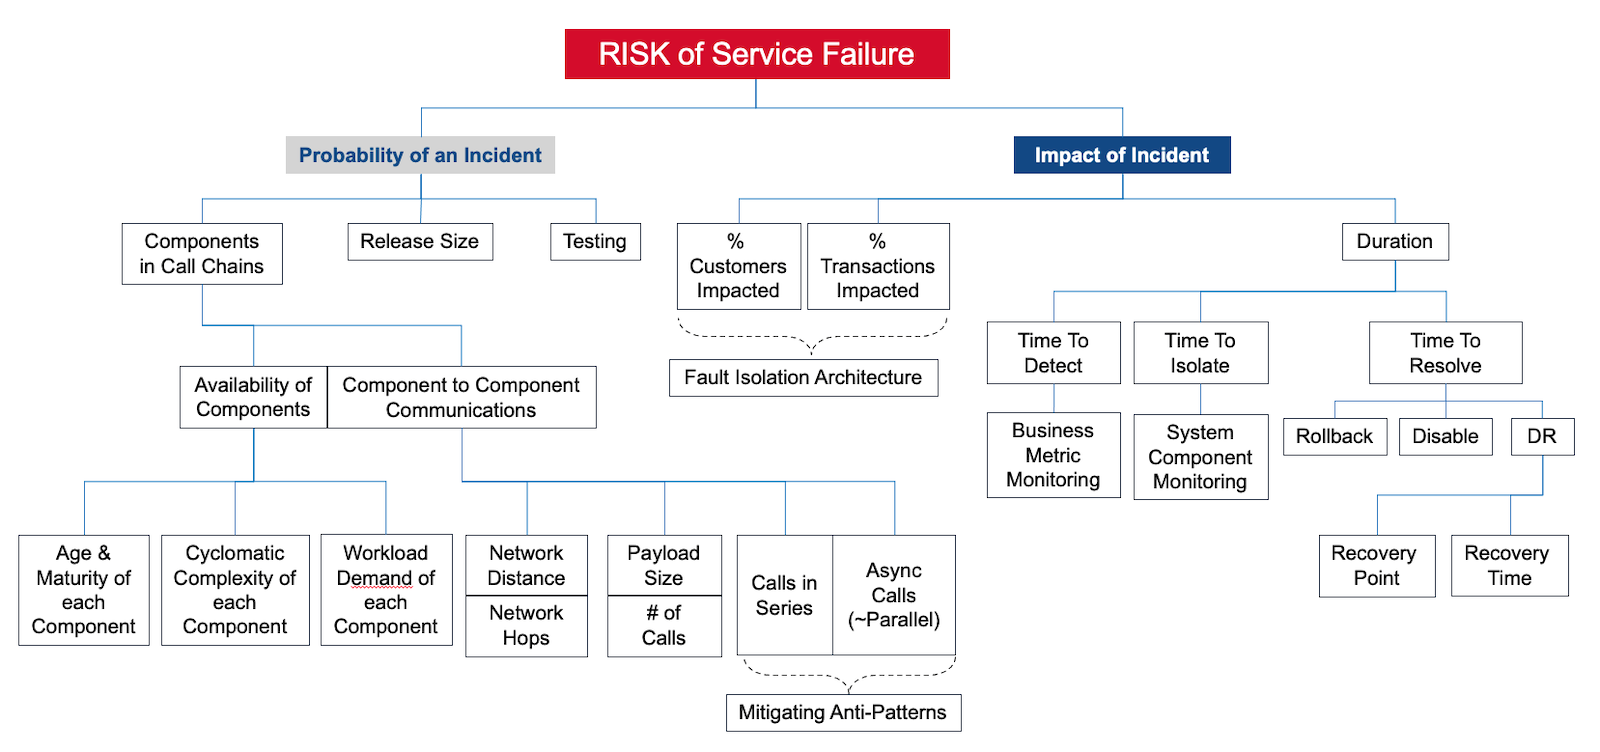
Availability Risk = Probability x Impact
Starting at the top of the model, the Availability Risk is the product of Probability x Impact.

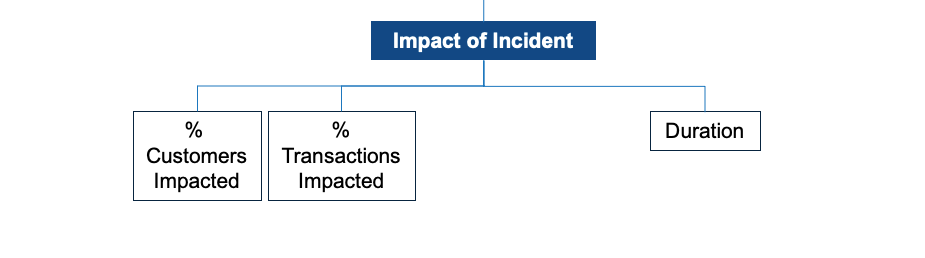
Impact of an Incident
We often refer to the Impact as the Blast Radius. The Impact is a function of:
- Duration,
- the % of Customers Impacted,
- and % of Transactions Impacted.
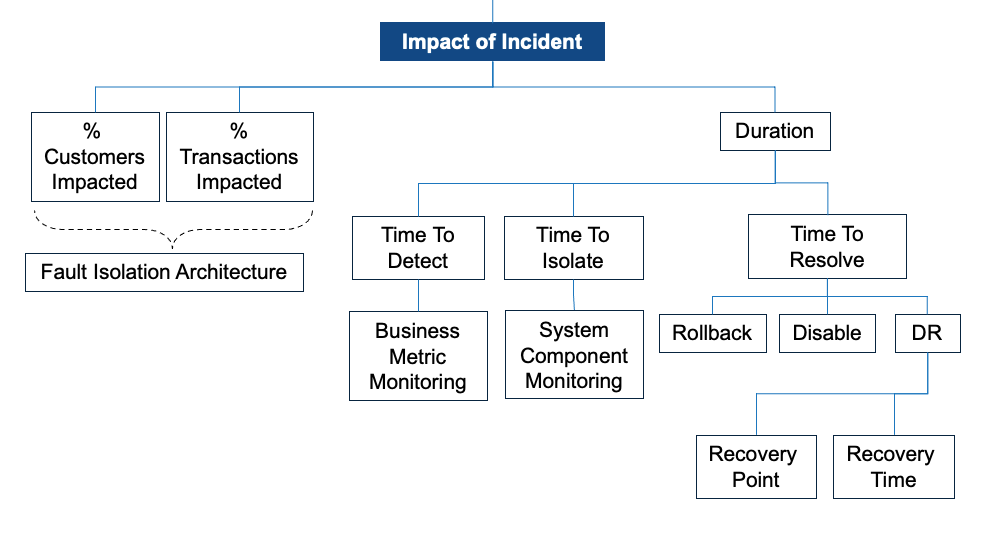
A fault-isolated architecture can reduce the percent of customers and transactions impacted. You can shard or split services by customers - our AKF Z axis split. Or, you can split by functionality - our Y axis split. See our Scale Cube article to understand our X, Y, and Z model.
Duration is a function of your TTD, TTI, and TTR:
- TTD - Time to Detect. How soon do you know you have an incident or bigger problem?
- TTI - Time to Isolate. How fast can you isolate the problem to know how to fix it?
- TTR - Time to Resolve. How fast can you restore services?
Different techniques and approaches can improve TTD, TTI, and TTR. The most common are:
- Time to Detect. Monitoring is the high level approach here. But, not simply system monitoring such as CPU, memory, disk, or network. Business monitoring is necessary to improve Time to Detect. For example, seeing particular workflows slowing or lower-than-normal visitors is a leading indicator.
- Time to Isolate. Monitoring is the high level approach here as well. System level monitoring and component specific tools are necessary here. For example, identifying a specific database thread or query blocking other transactions.
- Time to Resolve. If the problem is small, you may be able to Disable a component or Rollback a change. If there is a widespread problem due to a Disaster, your will execute your DR plan. If you haven't tested your DR plan, your Recovery Point and Recovery Time Objectives are a guess.
See our article Monitoring the Good, the Bad, the Ugly for Improved Fault Detection.
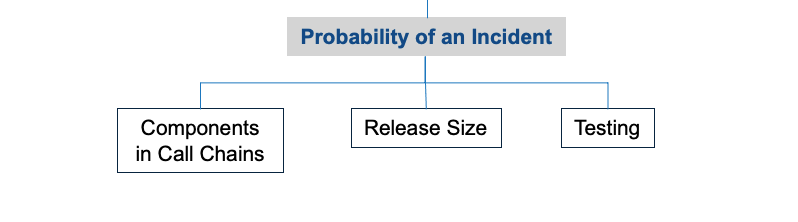
Probability of an Incident
This is where our Risk Model illustrates the land mines for distributed architectures. Probability of a service failure is a function of:
- Release size. Small changes to the production environment are better than large ones. Every line of code has a small probability of failure. The more code, the higher the probability of an incident. As releases grow in size (# of lines of code), the probability of an incident increases. The impact (blast radius) also increases.
- Testing. More testing is desirable. Automated testing is more cost effective than manual.
- Components in Call Chains. Distributed architectures involve services talking to one another. How each component behaves in isolation and a connected call chain drives Availability.
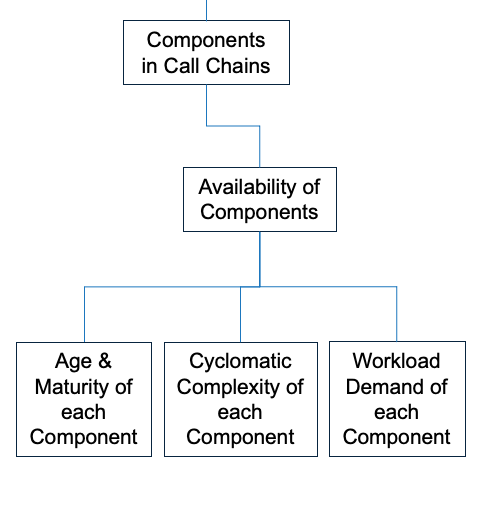
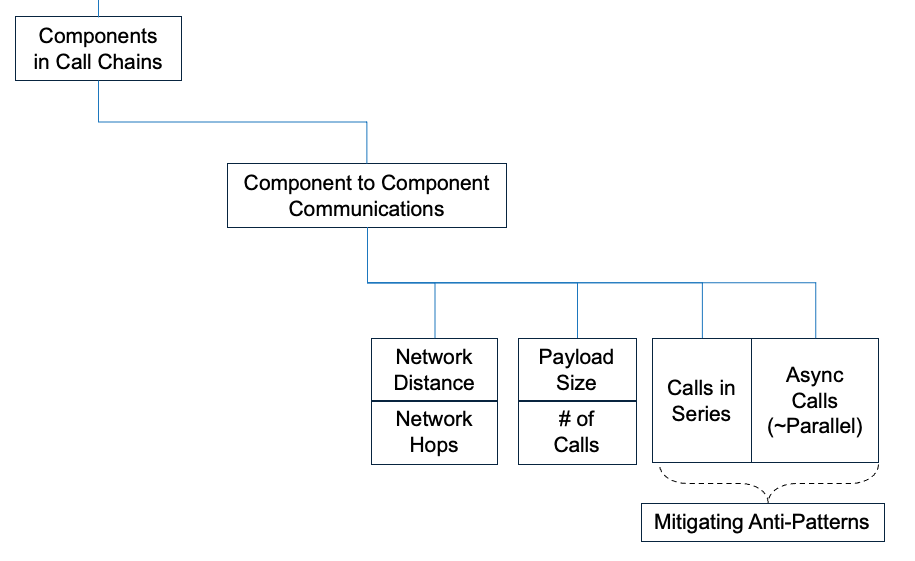
Components in Call Chains
This is where many of our clients underestimate the risk of downtime. Components in Call Chains, as the name implies, are a function of:
- Availability of Components
- Component to Component Communications
Availability of Components is a function of:
- Age and Maturity of Each Component. Components have an ideal useful life (i.e. the bathtub effect). Not too young, not too old.
- Cyclomatic Complexity of Each Component. More complex workloads are more likely to fail. Large complex monoliths become a problem.
- Workload Demand of Each Component. As utilization nears 100%, failure is imminent. Scaling up to larger components has diminishing returns. There is always a ceiling for scaling up. Do not be near it.
Component to Component Communications is the concept many of our clients miss.
Once understood, it is easy to spot a potential problem. The Probability of failure in Component to Component Communications is a function of:
- Network distance and hops - distance increases latency. More hops adds latency and increases the likelihood of failure.
- Payload size and # of calls - bigger payloads increase latency and failure rates. More calls increases failure rates.
- Calls that behave Asynchronously vs Synchronously.
Synchronous calls operate as if they are in series - when one fails, the entire call chain fails. Asynchronous calls operate differently - the likelihood of failure is more like a circuit in parallel. The mathematical probability is stark. The difference in expected downtime can vary from:
- hours and days for Series vs
- hours and seconds for Asynchronous calls
This difference in expected downtime is the reason why architects must be able to identify Anti-Patterns. They must understand the trade-offs for different Patterns to remediate Anti-Patterns. Anti-Patterns dramatically increase the likelihood of failure.
The Full Availability Risk Model
Seeing the entire model helps architects, teams, and leaders understand Risk drivers.
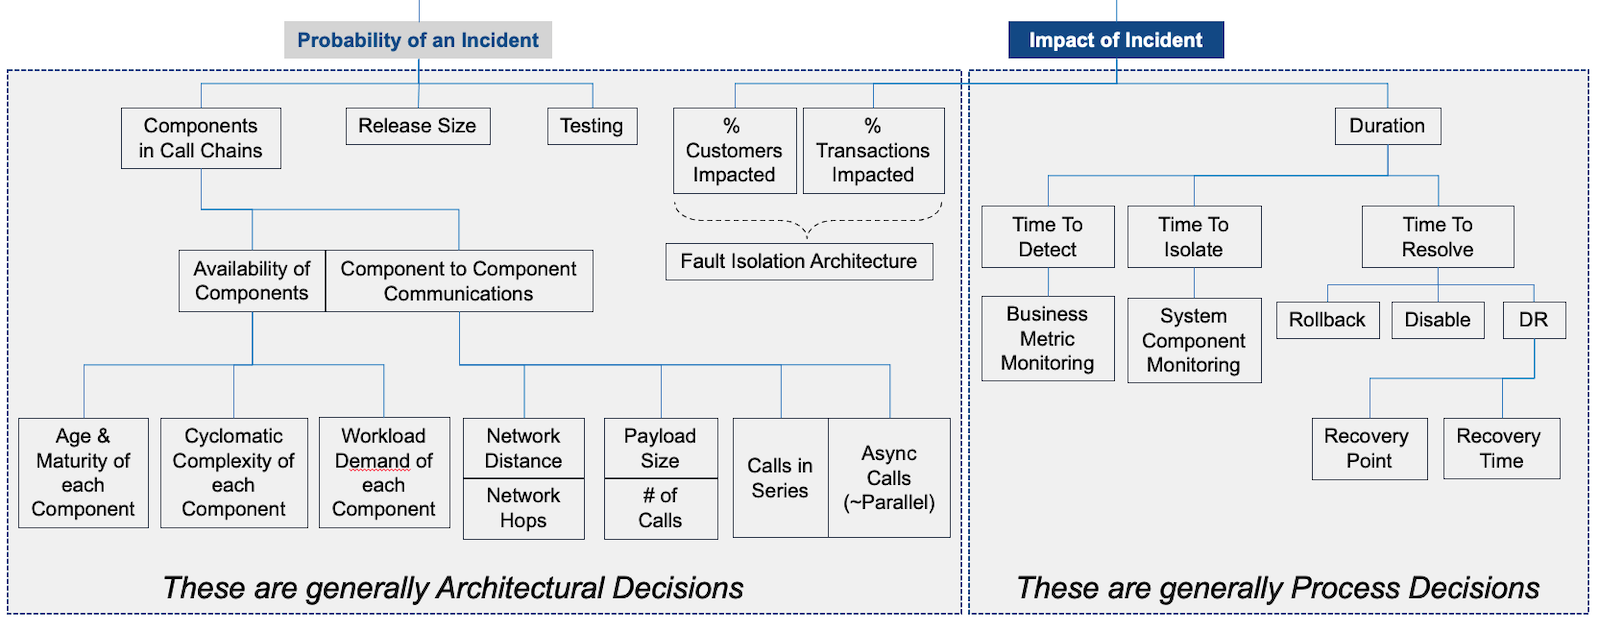
Note that items on the left are generally Architectural decisions. Those on the right are generally Process decisions.
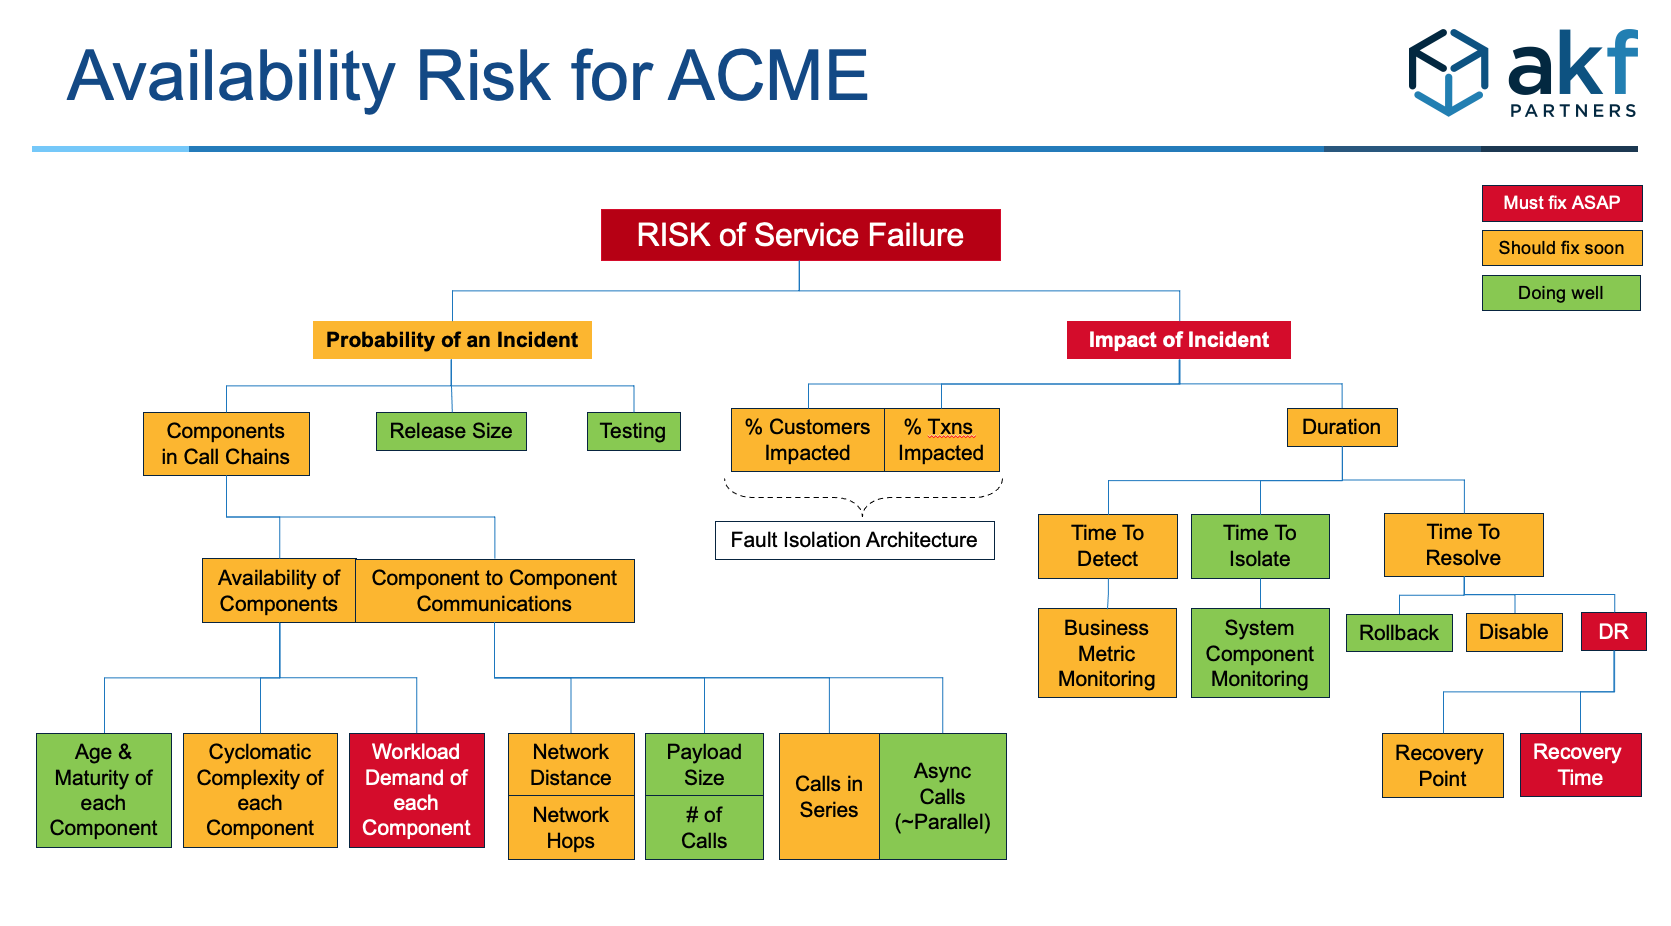
For a recent client, we heat mapped one of their primary platforms. The heat map helped teams assess their overall risk profile. It also helped the team understand the cascading risks of failure. It also helped our client rank which steps to mitigate first.
Learn More
Our webinars cover this topic in more detail.
Assessing Your Availability Risk
If you need help assessing your architecture, call us. Depending on the size of your engineering team, this exercise can be a short as a 3 hours or as long as 3 days. You can contact us, or download this PPT template for your organization.