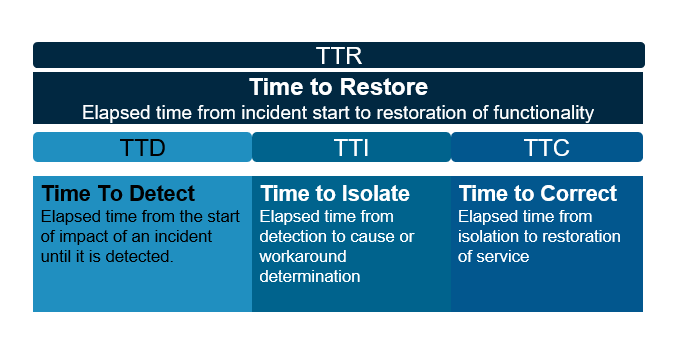
AKF often recommends to our clients the adoption of business metric monitoring – the use of high-level user activity or transaction patterns that can often provide early warning of an incident. Business metric monitors will not tell you where or what the problem is, rather – and most importantly – they tell you something appears to be abnormal and should be investigated, that something has affected your customer experience.
A significant part of recovery time (and therefore availability) is the time required to detect and localize service incidents. A 2013 study by Business Internet Group of San Francisco found that of the 40 top-performing websites (as identified by KeyNote Systems), 72% had suffered user-visible failures in common functionality, such as items not being added to a shopping cart or an error message being displayed.
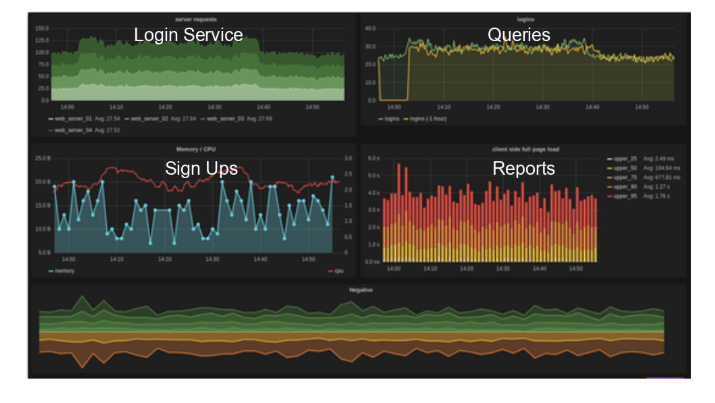
Our conversations with clients confirm that detecting these failures is a significant problem. AKF Partners estimates that 75% of the time spent recovering from application-level failures is time spent detecting them! Application-level failures can sometimes take days to detect, though they are repaired quickly once found. Fast detection of these failures (Time to Detect – TTD) is, therefore, a key problem in improving service availability.
The duration of a product impairment is TTR.
To improve TTR, implement a good notification system that first, based on business metrics, tells you that an error affecting your users is happening. Then, rely upon application and system monitoring to inform you on where and what has failed. Make sure to have good and easy view logs for all errors, warnings and other critical data your application creates. We already have many technologies in this space and we just need to employ them in an effective manner with the focus on safeguarding the client experience.
In the form of Statistical Process Control (SPC – defined below) two relatively simple methods to improve TTD:
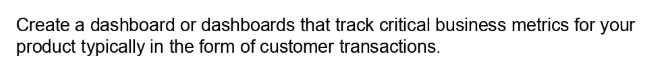
- Business KPI Monitors (Monitor Real User Behavior): Passively monitor critical user transactions such as logins, queries, reports, etc. Use math to determine abnormal behavior. This is the first line of defense.
- Synthetic Transactions (Simulate User Behavior): Synthetic transactions are scripted actions that attempt to mimic real customer behavior. Examples might be sign-ons, add to cart, etc. They provide a more meaningful view of your customers’ experiences vs. just looking at page load times, error rates, and similar. Do this with Keynote or a similar product and expand it to an internal systems scope. Alerts from a passive monitor can be confirmed or denied and escalated as appropriate. This is the second line of defense.
Monitor the Bad – potential, & actual bad things (alert before they happen), and tune and continuously improve (Iterate!)
If you can’t identify all problem areas, identify as many as possible. The best monitoring starts before there’s a problem and extends beyond the crisis.
Because once the crisis hits, that’s when things get ugly! That’s when things start falling apart and people point fingers.
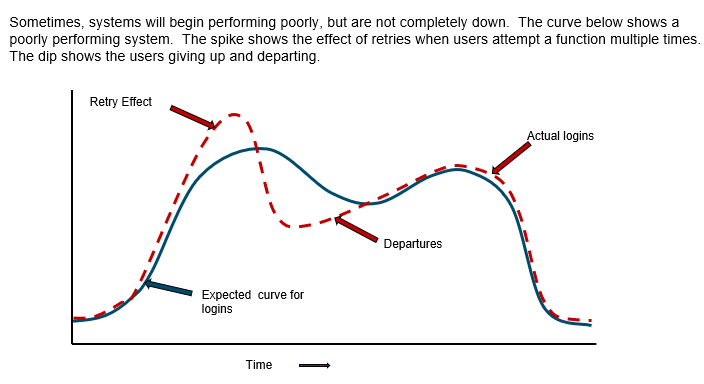
At times, failures do not disable the whole site, but instead cause brown-outs, where part of a site’s functionality is disabled or only some users are unable to access the site. Many of these failures are application-level failures that change the user-visible functionality of a service but do not cause obvious lower-level failures detectable by service operators. Effective monitoring will detect these faults as well.
The more proactive you can be about identifying the issues, the easier it will be to resolve and prevent them.
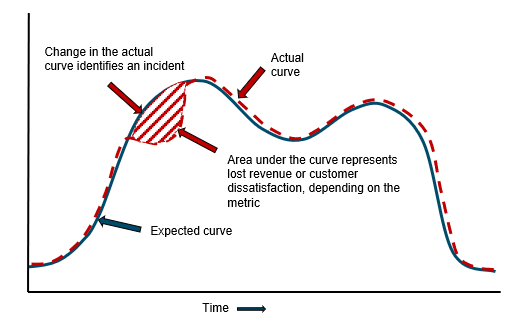
In fault detection, the aim is to determine whether an abnormal event happened or when an application being monitored is out of control. The early detection of a fault condition is important in avoiding quality issues or system breakdown, and this can be achieved through the proper design of effective statistical process control with upper & lower limits identified. If the values of the monitoring statistics exceed the control limits of the corresponding statistics, a fault is detected. Once a fault condition has been positively detected, the next step is to determine the root cause of the out-of-control status.
![]()
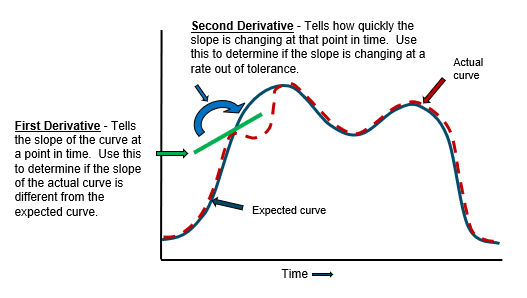
One downside of the SPC method is that significant changes in amplitude (natural increases in your business metrics) can cause problems. An alternative to SPC is First and Second Derivative testing. These tests tell if the actual and expected curve forms are the same.
Here’s a real-world example of where business metrics help us determine changes in normal usage at eBay.
We had near real-time graphs of user metrics such as bids, listings, logins, and new user registrations. The data was graphed week over week. Usage patterns throughout a day followed a readily identifiable pattern with peaks and valleys. These graphs were displayed in the Network Operations Center, which was staffed 24x7. Deviations from the previous week’s pattern had proven useful, identifying issues such as ISP instability in the EU impacting customers trying to access eBay.
Everything seemed normal on a Wednesday evening – right up to the point that bids and listings both took a nosedive. The NOC quickly initiated the SEV1 process and technical resources checked their areas. The site had no identifiable faults, services were confirmed to be working fine, yet the user activity was still markedly lower. Roughly 20 minutes into the SEV1 process, the root cause was identified. The finale episode of American Idol was being broadcast. Our site was fine – but our customers had other things on their mind. The business metric monitors worked – they gave warning of an aberrant usage pattern.
How would your company react to this critical change in normal usage patterns? Use business metric monitors to detect workload shifts.