AKF was brought in for an architectural assessment for a critical new capability for one of our larger clients. This client is expanding core capabilities from on-premise mainframes to one of the primary iPaaS cloud hosting providers.
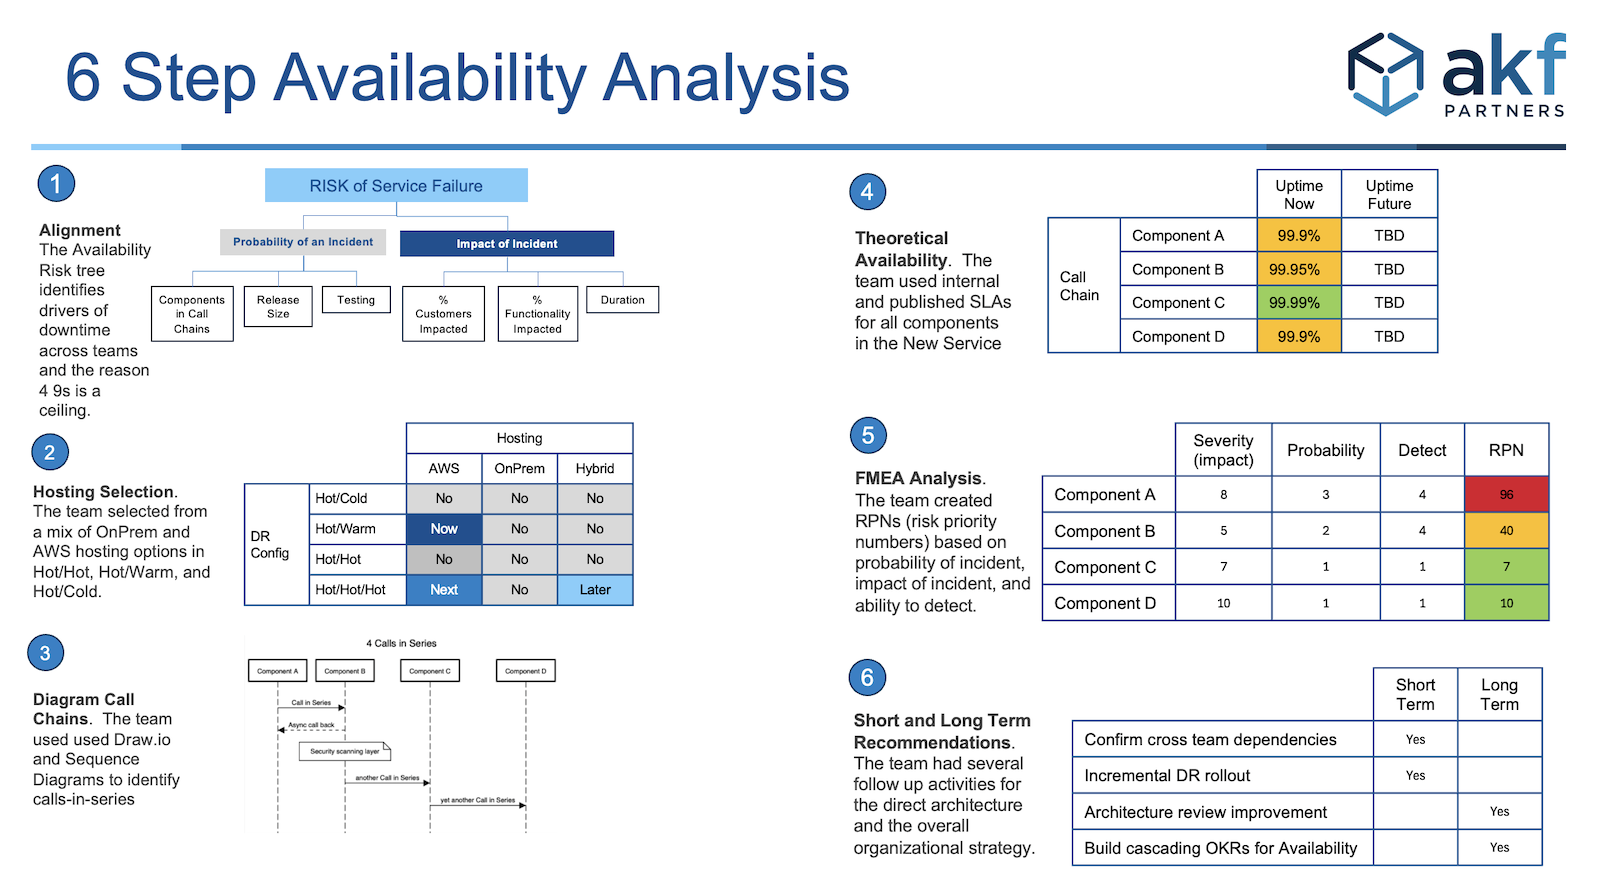
We followed a 6-step process in a series of workshops.
- Alignment on Availability Risk Drivers and Math.
- Identify deployment options. We evaluated a mix of full cloud, open-source OnPrem, and a hybrid approach for primary and disaster recovery.
- Diagram the architecture to understand call chains.
- Estimate theoretical availability following AKF Availability Math.
- Capture business risk and impact with Failure Mode Effect Analysis (FMEA).
- Identify short and longer term recommendations.
- Update theoretical availability and FMEA to create a go-forward decision.
Here are the steps in a bit more detail.
1. Alignment on Availability Risk Drivers and Math
The larger team of application engineers, networking, system administrators, and DBAs went through a quick primer on the AKF Availability Risk Model and Availability Math.
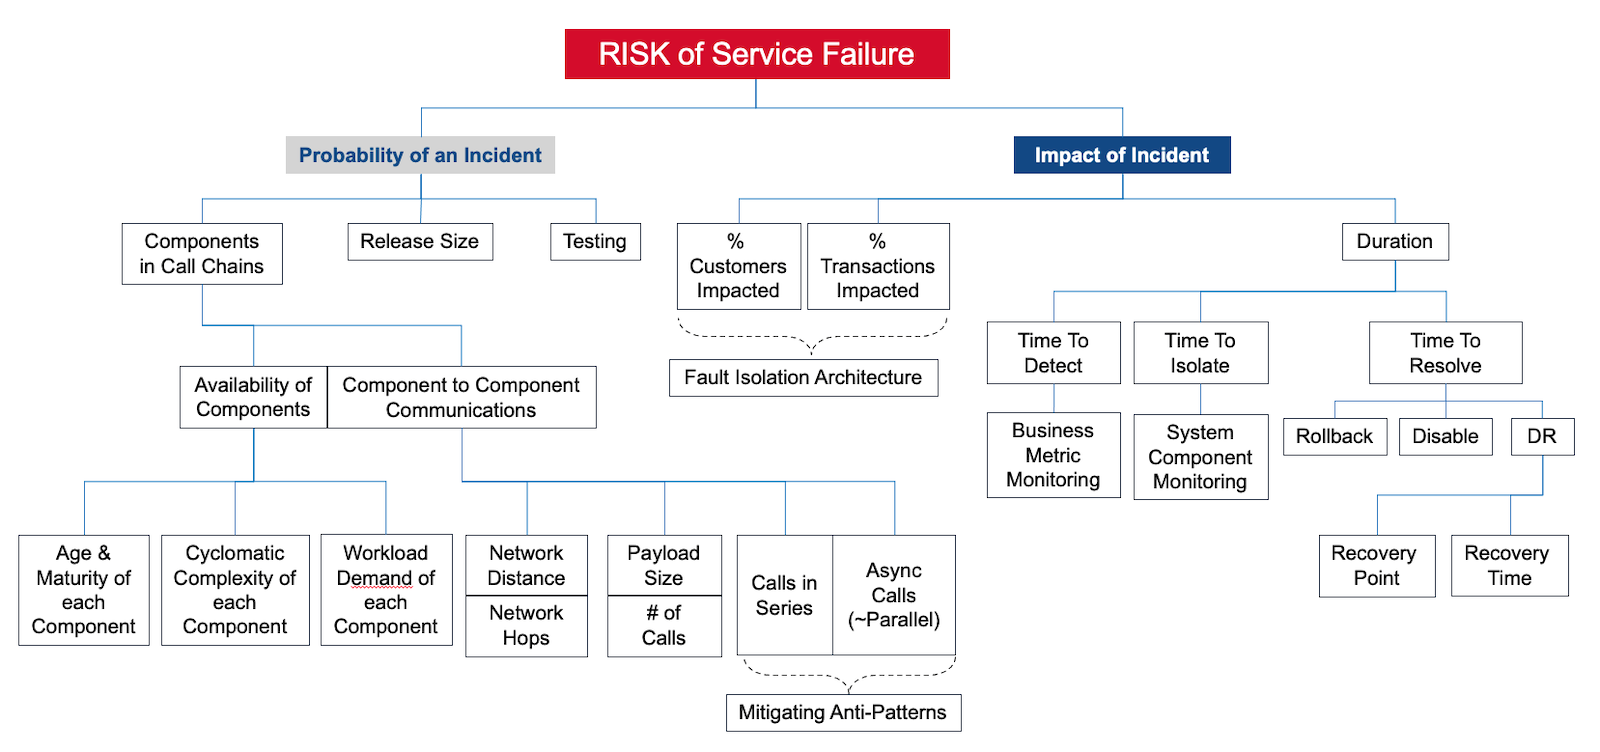
Walking through the risk tree opened communication lines across teams responsible for the end-to-end delivery of new services.
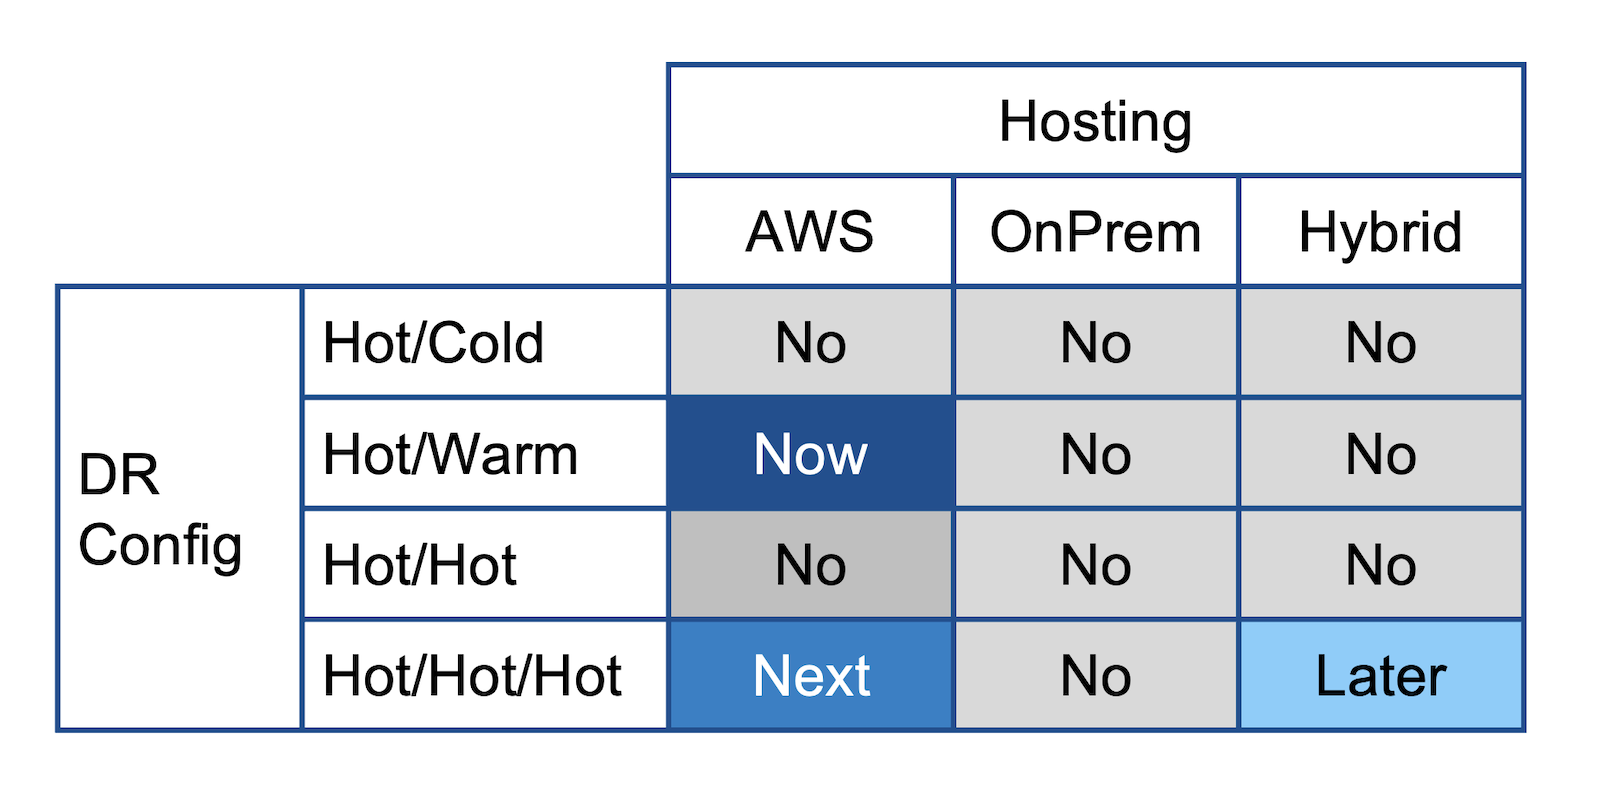
2. Identify deployment options.
For this discussion, we evaluated several variations which yield a dozen choices:
- Active/Passive – with all customers in 1 primary US region
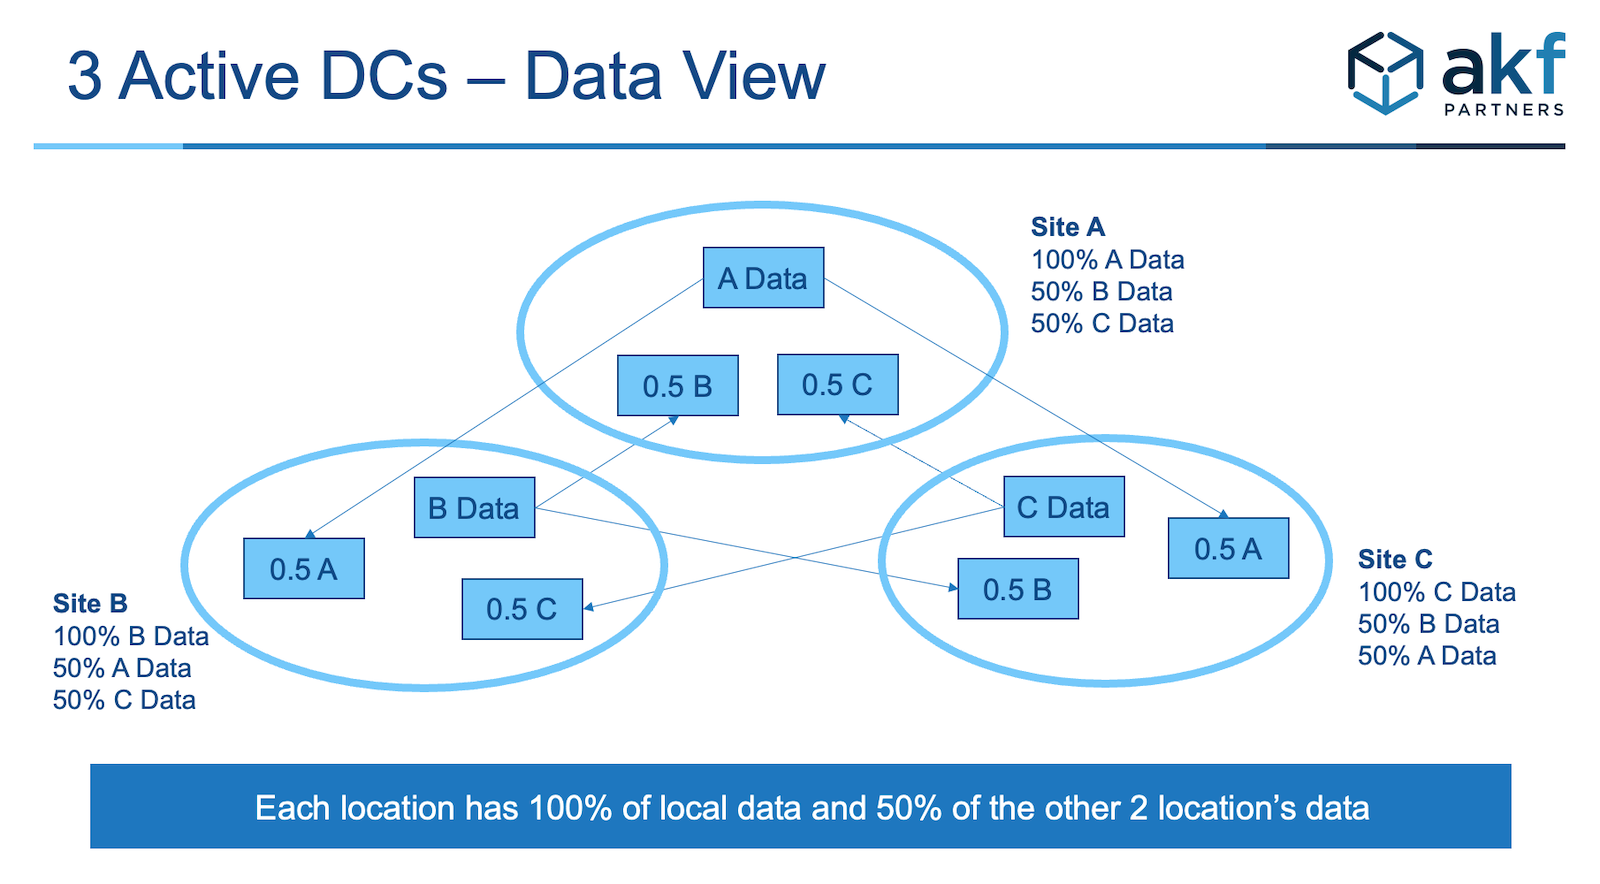
- Active/Active – with customers split into 2 US regions
- Active/Active/Active with a split of customers on the Z-axis across 3 US regions
- On-Prem, Cloud, and hybrid (e.g. primary in Cloud, failover in On-Prem, or hybrid)
Each option was quickly evaluated for:
- feasibility - can we do it (do we have the internal skills)
- time to market - how quickly can we do it (do we have cross-team dependencies)
- performance - what are expected latencies with the architecture vs market needs
- cost - total upfront and ongoing cost
These were all important aspects and most options were eliminated, but we needed to model Availability to gain alignment and sponsorship to decide between 3 high level choices. The availability target was 99.97%. Hence the remainder of the workshop.
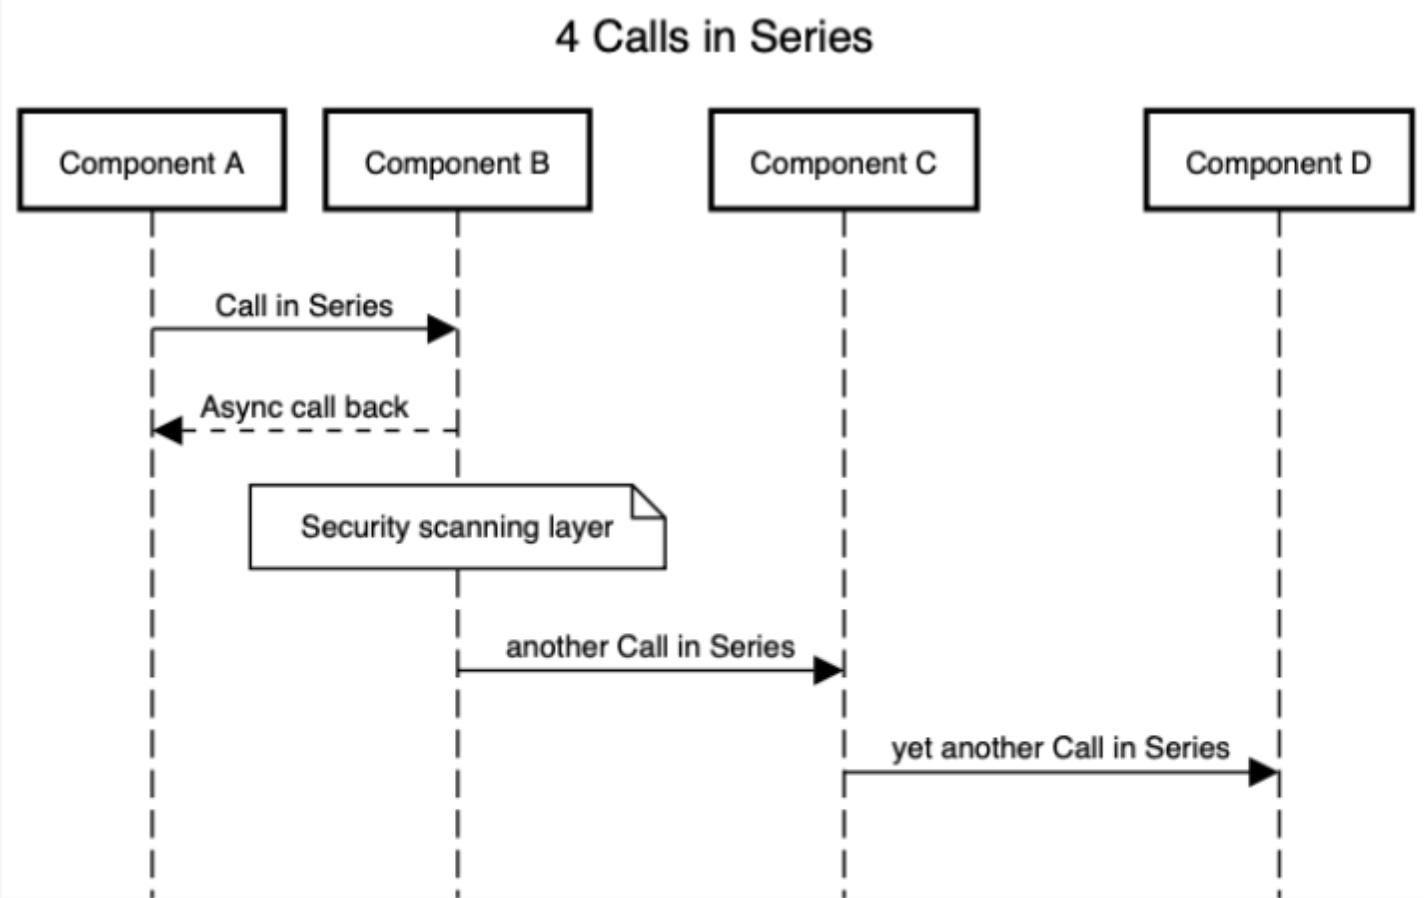
3. Diagram the architecture to understand call chains
The primary decision driver was identifying calls that behaved in series.
Our client’s architects used a mix of freely available tools:
- Draw.io – to show the overall components and dependencies for the various deployment options.
- https://sequencediagram.org – to identify call chain dependencies for the final 2-3 design choices
The AKF Risk Model helped identify some common missing components including routers and firewalls. These additional components behaved in serial and were initially overlooked.
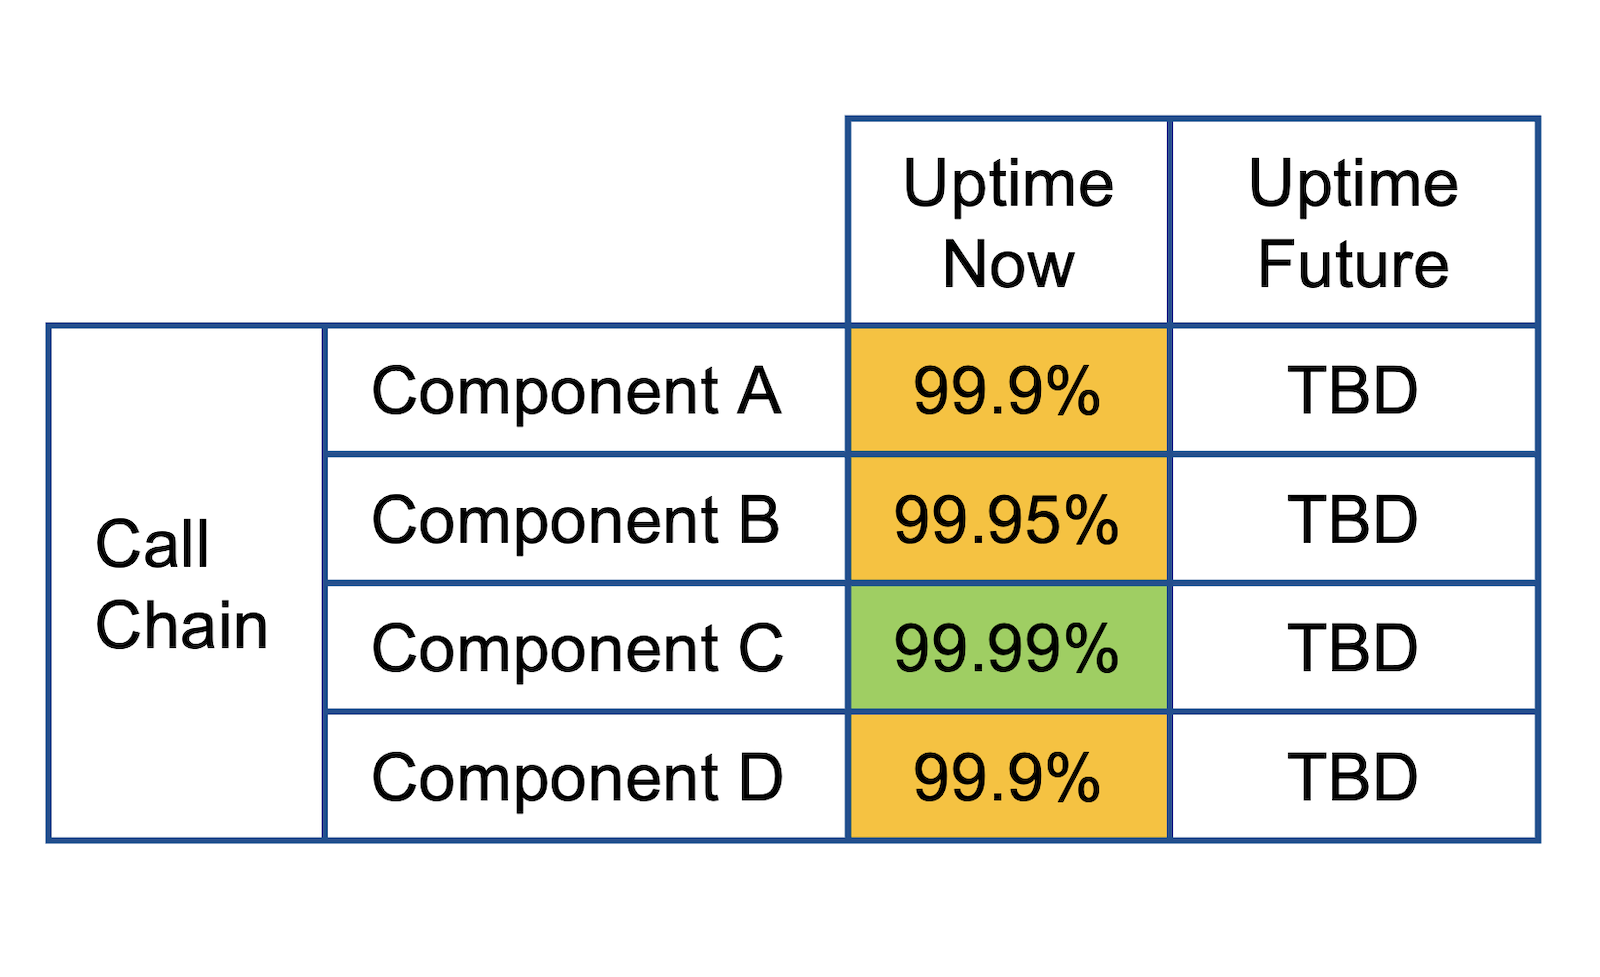
4. Estimate theoretical availability following AKF Availability Math
The team used the output from the Sequence Diagram to model theoretical availability. Recall that our math is a quick proximation. It is not mathematically correct, but close enough for engineering purposes. We identified any Availability Anti-Patterns that are mathematically approximated as calls in series.
The team estimated the theoretical availability of the final 3 design choices:
- Active/Passive – customers in 1 region
- Active/Active – customers in 2 regions
- Active/Active/Active – customers in 3 regions
The initial Active/Passive design was well below the 99.98% target.
The Active/Active configuration was very close to the 99.98% target but was more costly than the 3rd option.
The 3rd option provided the highest availability and at a lower cost than the 3rd option.
Note that challenge that almost delayed the project was the identification of a sharding key that aligned well with the geographical distribution of customers to primary regions.
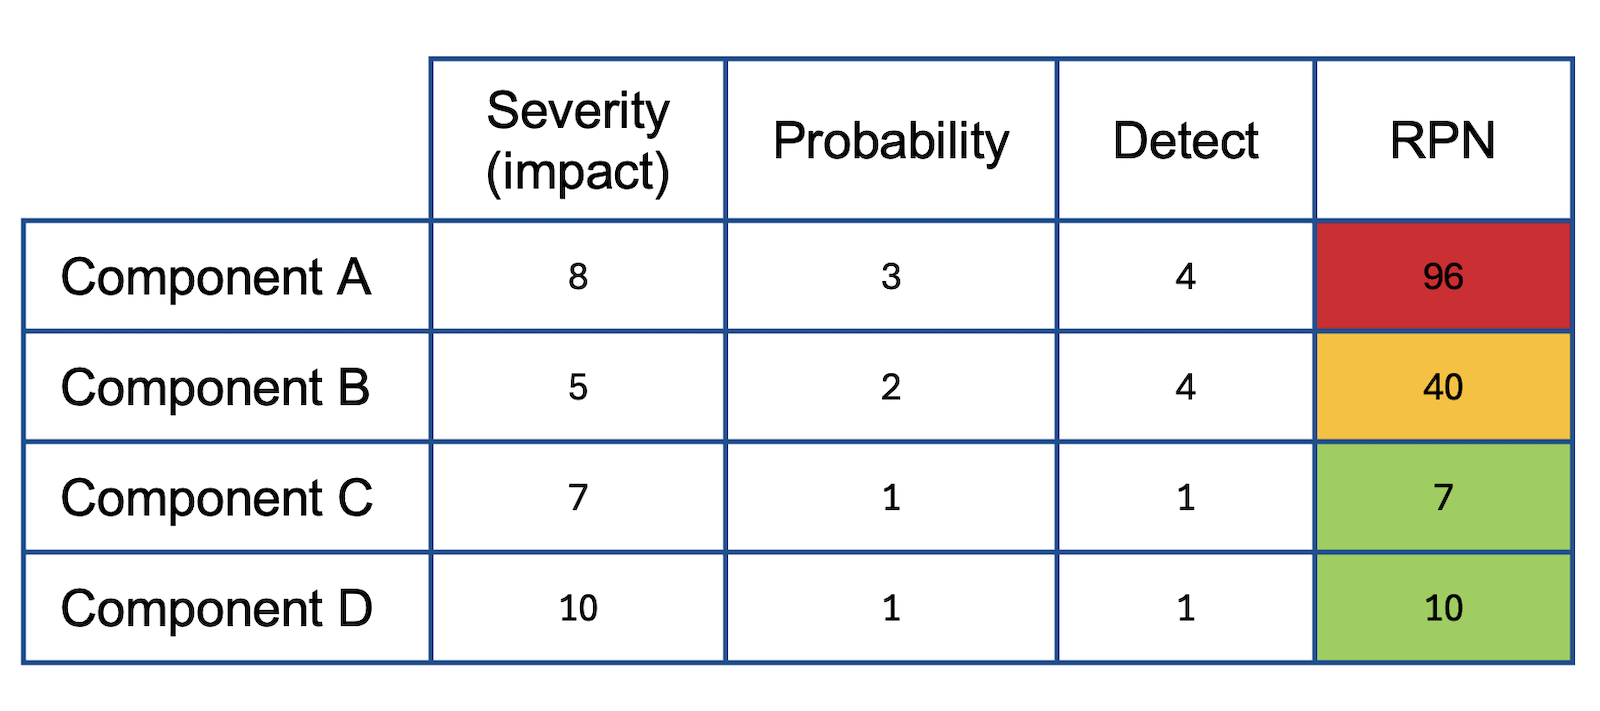
5. Failure Mode Effect Analysis
The team then shifted to FMEA analysis. This approach was helpful to communicate and coordinate with business stakeholders. Many stakeholders were familiar with FMEA analysis from prior work experience.
FMEA uses a 1-10 scoring scale. The team utilized a ‘poker planning’ and ‘relative estimate’ approach to estimating:
- ability to detect,
- probability of occurrence,
- and business impact
Our facilitator captured the scores, justifications, and managed discussions where there were discrepancies in individual scores and cross-referencing similar scores.
6. Capture short & long term recommendations
From the prior analysis, the team was more informed to identify short and long term approaches to select the final architectural recommendations.
- Short term - cross team dependencies. One of the short term recommendations was confirming cross-team dependencies. Not all stakeholders that managed components in the call chain were available for FMEA workshops. Missing these stakeholders yielded some estimated FMEA scores which needed validation. However, the team intuitively understood cross-cutting dependencies which impacted the architecture.
- Short term - incremental DR rollout. The team decided on an incremental approach to move from Active/Passive to Active/Active/Active.
- Long term - continual improvement. Another result of the workshop was the incorporation of this Availability approach to large architectural design decisions and annual re-assessments to confirm dependencies and constraints as the overall architecture evolved due to organic and in-organic (M&A) customer growth. Adding FMEA analysis to monthly and annual operational reviews helps drive better outcomes.
- Long term - build cascading OKRs for Availability targets. Availability Math and FMEA focused on failures scenarios can hep build out OKRs focusing on high availability.
Contact Us
If you need help leading these workshops, would like our availability calculators in Excel, or would like to discuss more, simply reach out.