Our updated Availability Risk Model identified many risk drivers. The Risk tree showed components, but not the math to estimate downtime. We will highlight some aspects of the our Risk Model to show the likely ceiling of Availability.
Any service you create or consume is unlikely to exceed 99.99% availability. Yes, only Four 9s.
We will use some basic math and assumptions. The basic math we will use will not be 100% accurate, but close enough. As in 99.9% close enough.
These are the basic concepts that CTOs, engineers and product managers will need to know:
- Estimate downtime via expected uptime of each system
- Remember expected downtime for 99%, 99.9%, and 99.99% for a year or a month
- Components and communications that behave in series will lower your availability (number of 9s)
- Components and communications that behave in parallel will increase availability
- Identify what components of the architecture operate as series vs parallel communications
Expected Downtime via Expected Uptime
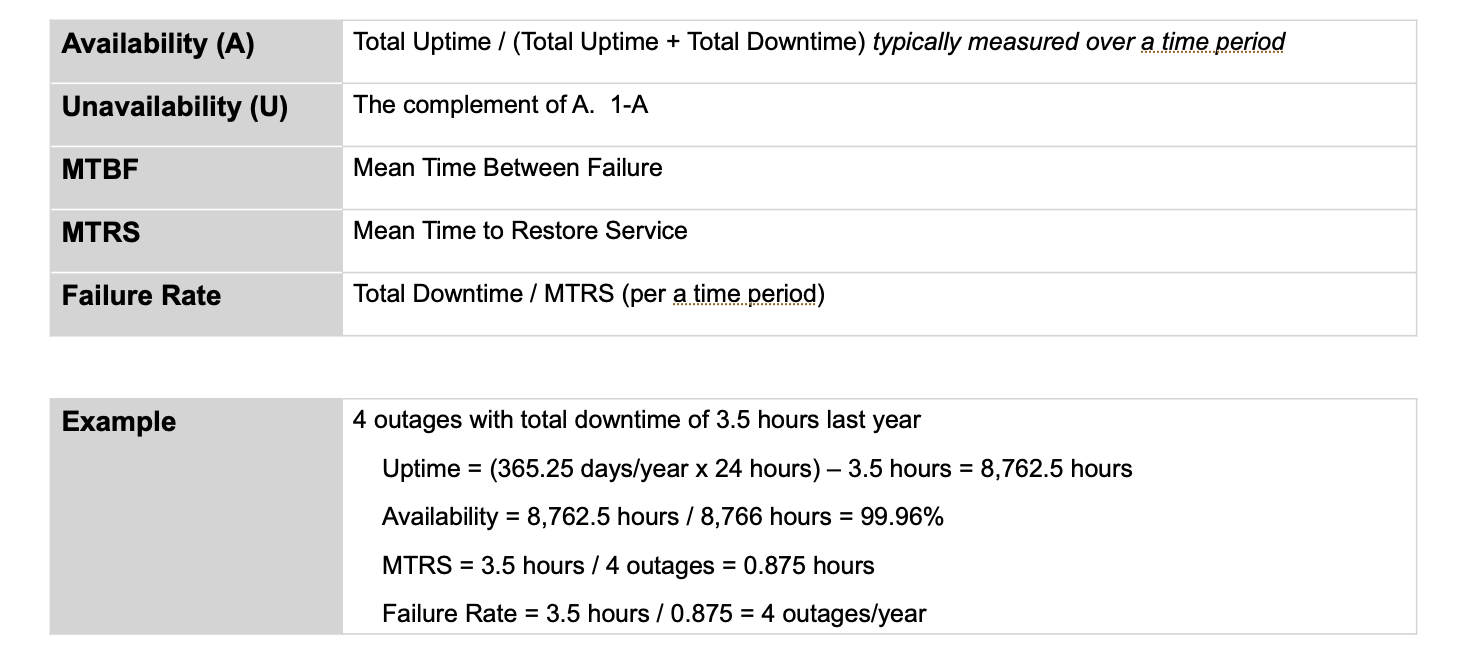
Our most mature clients have more robust ways of measuring availability. We will use actual calendar time for expected availability. Availability is the total uptime divided by the total possible time in a time period.

Related concepts are Mean Time Between Failure and Mean Time to Restore Service. For now, focus on Availability as Total Uptime divided by Total Uptime + Downtime.
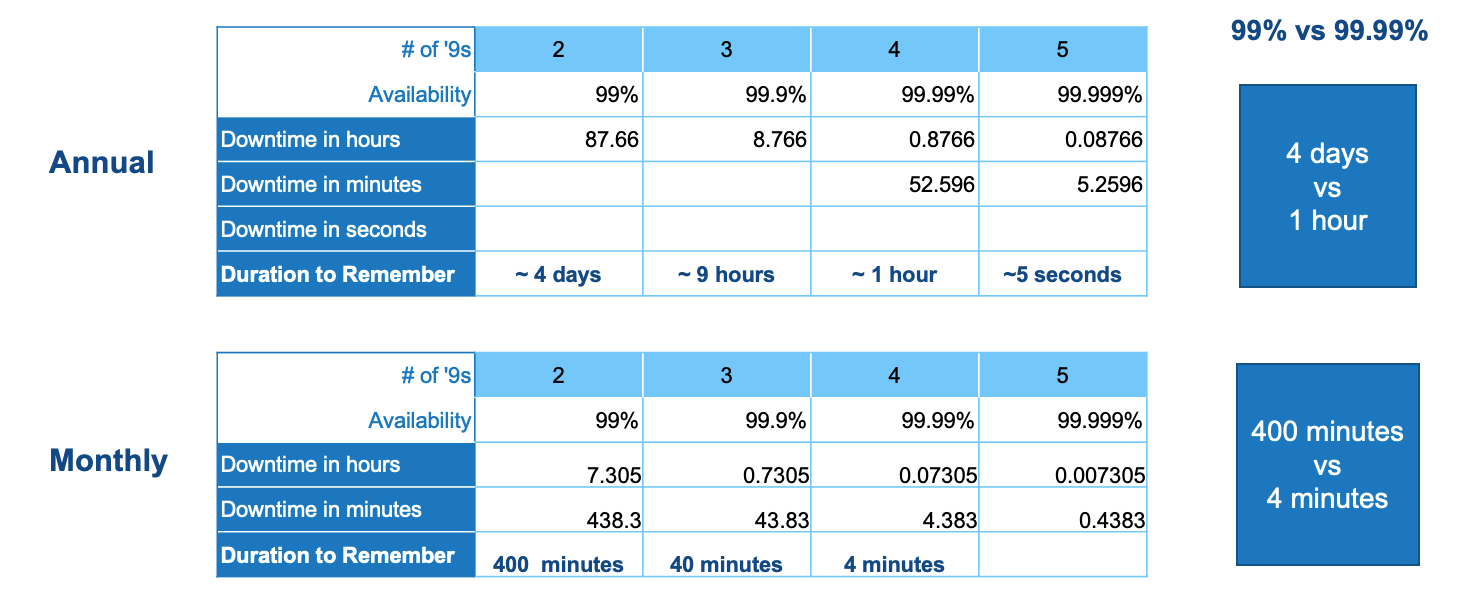
Annual and Monthly Downtime by 9s
Product Managers and Engineers should remember expected downtime on a yearly or monthly basis. Months are easier to remember how many minutes of downtime are expected for each 9 of availability. Yearly estimates may be more impactful for business stakeholders.
The difference in 99% availability and 99.99% (Two 9s vs Four 9s) on an annual basis is 4 days vs 1 hour.
The difference in 99% availability and 99.99% (Two 9s vs Four 9s) on a monthly basis is 400 minutes vs 4 minutes.
Availability for Components in Series vs Parallel
When components operate in series, any failure in a single component brings down the entire service. For series, Availability is the probability that all components are functional at a point in time.
When components operate in parallel, a failed component does not bring the entire service down. Response time may be reduced, but the service is available. For parallel, Availability is the probability that all components are non-functional at a point in time.
The example below shows an example of a circuit with 3 components for both series and parallel. Each component has 99% availability. That is, each component is expected to fail almost 4 days in a typical year.
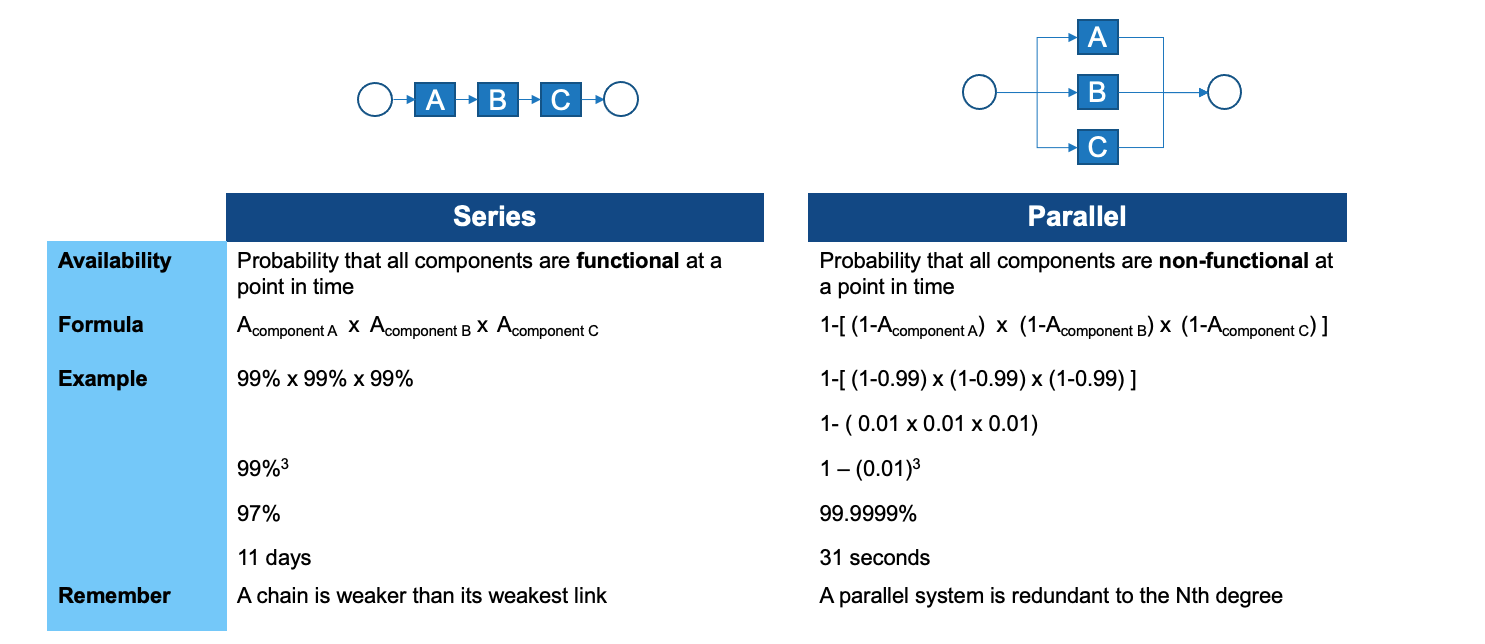
The Series example now has an expected Availability of 97%. We have gone from 4 days for each component to 11 days for the entire system!
The Parallel example now has an expected availability of 99.9999%. We have gone from 4 days for each component to 31 seconds.
To relate Series to the real world, imagine your daily commute requires you to drive to:
- Drive to a train station
- Take the train to the city
- Take a bus from the city train station to your office
Also, imagine your car, the train, and the bus each have 99% availability. Because any failure on your trip causes you to stop, you are operating in series. Your availability for your commute is now 97%.
Now, let's use a parallel example for your commute. Imagine your daily commute requires you to drive to your office. You have 3 vehicles at your disposal:
- A car
- A motorcycle
- An electric bicycle
If each of these vehicles has 99% availability, but you are free to use any of them if another one has failed, your availability is now 99.9999%. The probability that all 3 of your vehicles are not working at the same time is very small. Granted, commute times are different for each vehicle. Another household member can't be using your other vehicles. Upfront and ongoing expenses are different for each vehicle. Fatality rates are different for each vehicle. We are only focused on understanding uptime or Availability.
Software services do not map 100% to electronic circuits for series vs parallel. But, they are close enough to approximate when components and communications operate in Series. Whenever a component or communication operates in Series, it brings down the entire service chain.
For more accurate Availability calculations and to better understand the interaction of series and parallel components, the introductory concepts taught by Bob Warfield at Access Research Company are very helpful. Bob provides a free Excel calculator and real world examples to walk through.
Availability for a Single Service on a Single Machine
We'll shift our example to a standalone service. This service runs on a single physical machine in a data center or cloud provider. For the example, imagine this is your eCommerce service or system. This example also applies for a virtual machine. Somewhere, your eCommerce is running on a machine.

This physical machine has several components to make it function.
Each of these components must be working for your eCommerce service to be Available. This means all components in your physical machine behave in Series. If any component is not working, the entire service is down.
For the eCommerce service to operate at 99.99% availability (Four 9s), how many subcomponents can operate at 99.999% availability?
This is a logarithmic math question. We are introducing exponents to make the math a bit easier to understand as we extend our example.

This means you can have 10 components each with 99.999% in your eCommerce service to achieve 99.99% availability.
Yet, at 8 components, the availability is nearing Four 9s. That is, 8 components at 99.999% yields an expected availability of 99.992%!
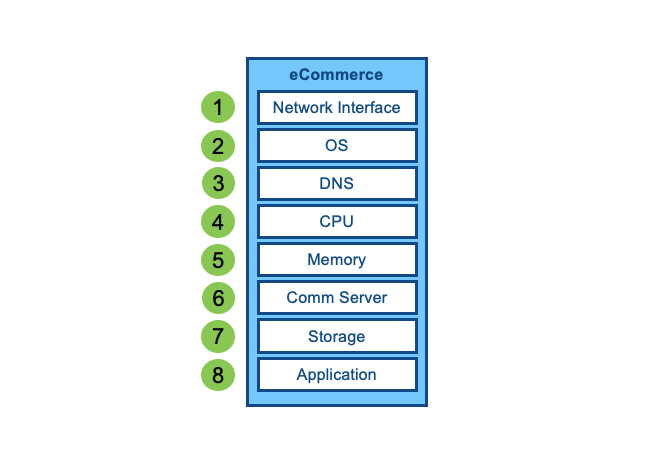
In the example above, many of these components should achieve 99.999%. Hardware generally has much higher availability than software. But the operating system and application are unlikely to achieve 99.999%. Simple restarts or reboots of the operating system or your core application will eat into your downtime budget.
Recall, all components behave in Series. For components in Series, the overall Availability will never by higher than the component with the lowest availability. The chain is weaker than its weakest link. It doesn't matter how many components have Five or Six 9s of availability. A single component with less than Four 9s will lower the overall availability.
So, a single service of 8 components at Five 9s yields a single service at Four 9s.
Service calling another Service
Let's extend our eCommerce example to call another service. We will split apart the web or application service from the database service.
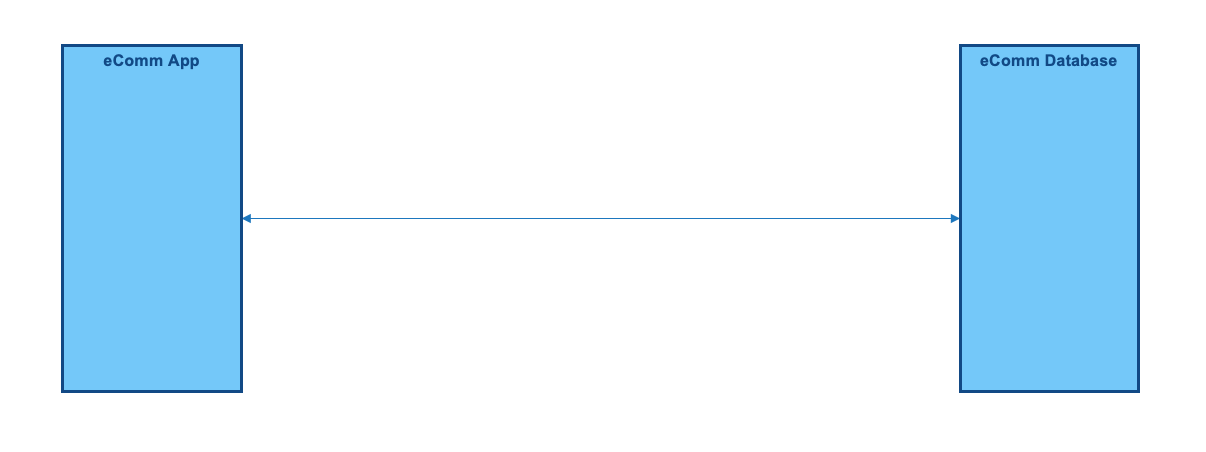
The application and database servers may be in the same data center or cloud availability zone.
For the application service to communicate with the database service, it must traverse a few devices. For example, traffic would go through a network switch, load balancer, and router. It may go through a firewall.
Each of these devices is a service. Just like your eCommerce service. These devices likely also need the same 8 components to be functional.
Thus, each service calling another service is making at least 3 hops. Each hop (the load balancer, switch, and router) must be available. They behave in Series for the eCommerce application and database server to communicate.
Each hop changes the exponent in availability.
We'll use the same availability assumptions for the original eCommerce service for each component in the chain.
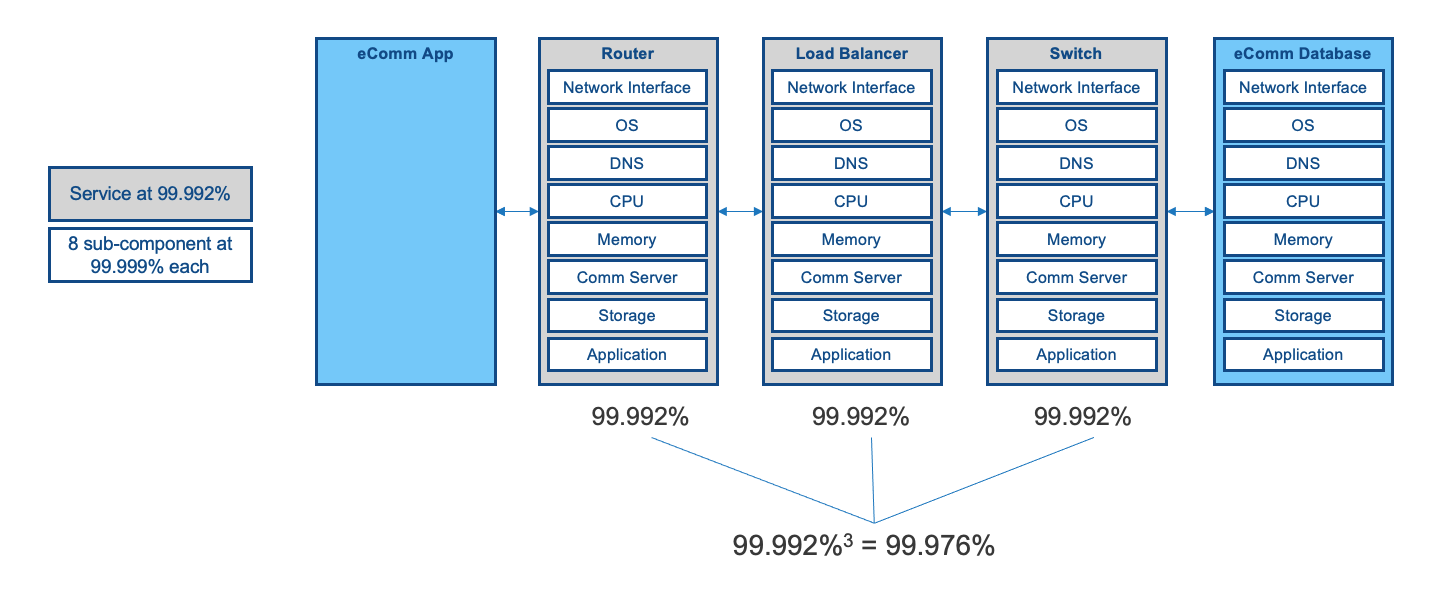
We are now below Four 9s for 1 service calling another.
So, with our simple example of an eCommerce application server at 99.99% and a database server at 99.99% in the same data center, the connected service is 99.976%.
Splitting eCommerce into Multiple Services
We'll extend the example to the real world. Due to size or complexity, even small businesses run eCommerce on multiple services. Many business stakeholders may not be aware that different machines or services are in operation.
Catalogs are often split apart from Search. Shopping Carts are sometimes split from Check Out. Check Out is often split from Payment. Order Management is often a different system that could connect to more systems such as Warehouse, Transportation, or Shipping systems.
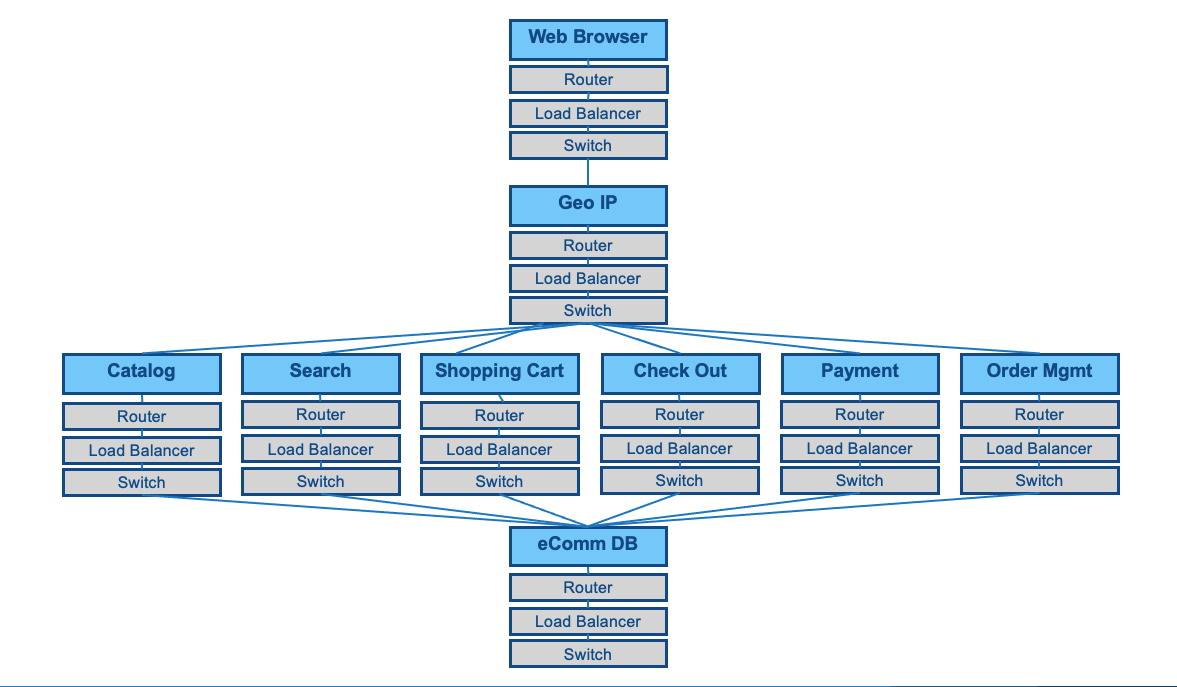
In this example, imagine that your development team or a 3rd party is still using a single shared database for all these services.
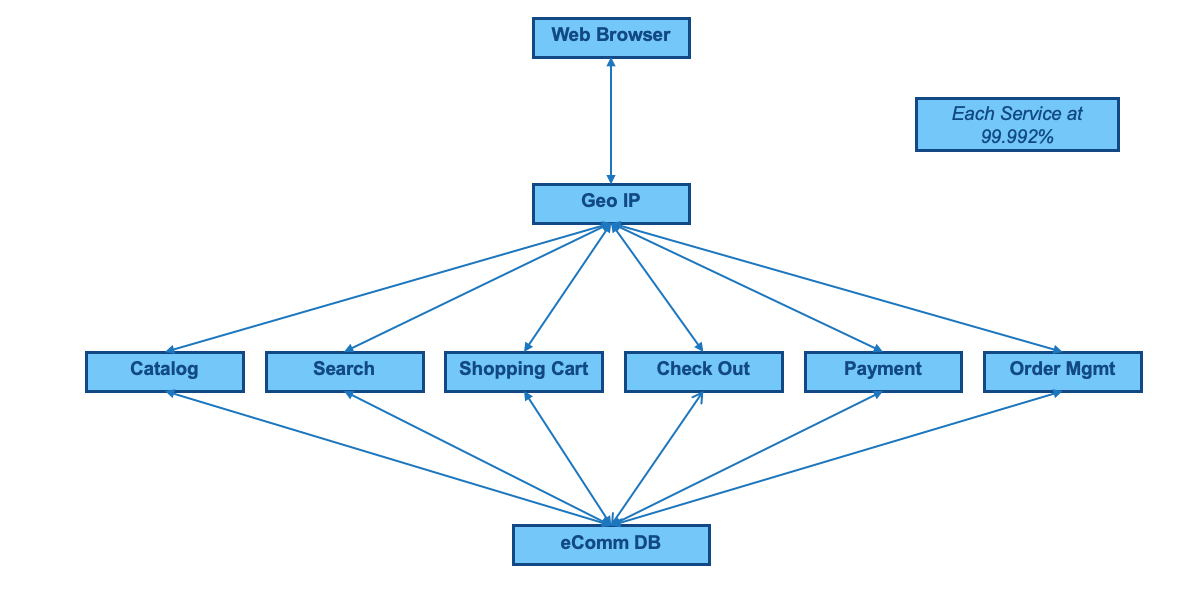
This example using a single database and 6 calling services is what we call an Anti-Pattern.
Anti-Patterns mean 'avoid or pay the consequences'. One of the consequences is lower availability.
This particular Anti-Pattern is a Data Fuse.
If any service in the call chain fails, all services fail. For example, Search could fail. Because Search is connected to the Database - it will fail. When the Database fails, all other services fail.
This looks like 9 connected services. Using our 99.992% availability of each service, this looks like 99.992%9. Which is 99.92%. This is three 9s or 6.3 hours of downtime in a year.
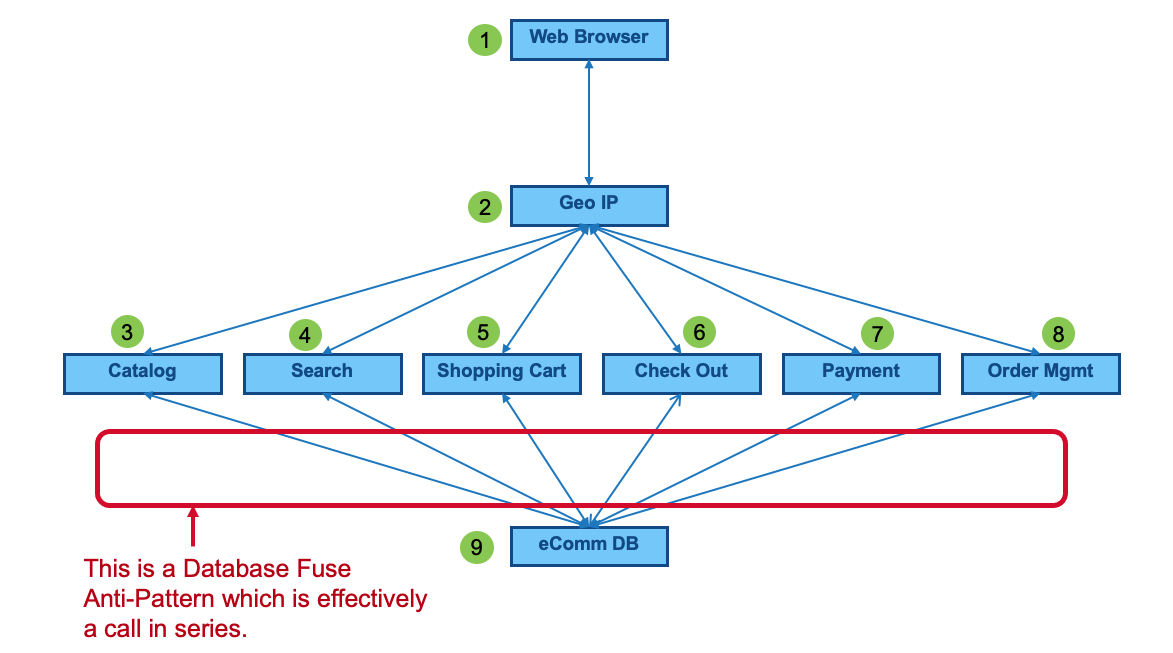
But - that isn't the full story. Recall from our previous example that each hop is really 3 hops. The math is now 99.992%27. The 27 in the exponent comes from 9 services in series x 3 calls per service. Which is 99.8% or two 9s. This is 19 hours of downtime.
Removing the Data Fuse Anti-Pattern
If we remove the Anti-Pattern and have each service talk to a dedicated database, we can improve availability.
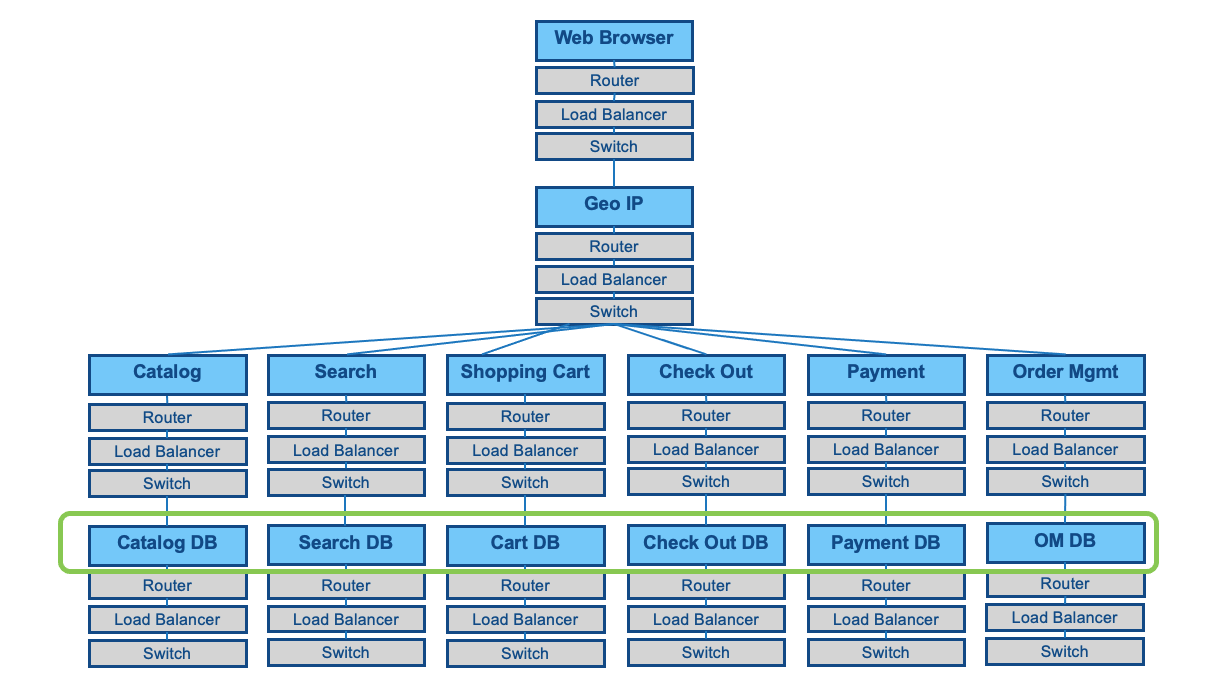
We can reduce the number of connected components to 12 in a single call path. We can move back to Three 9s. With this math, we should expect 8.4 hours of annual downtime.
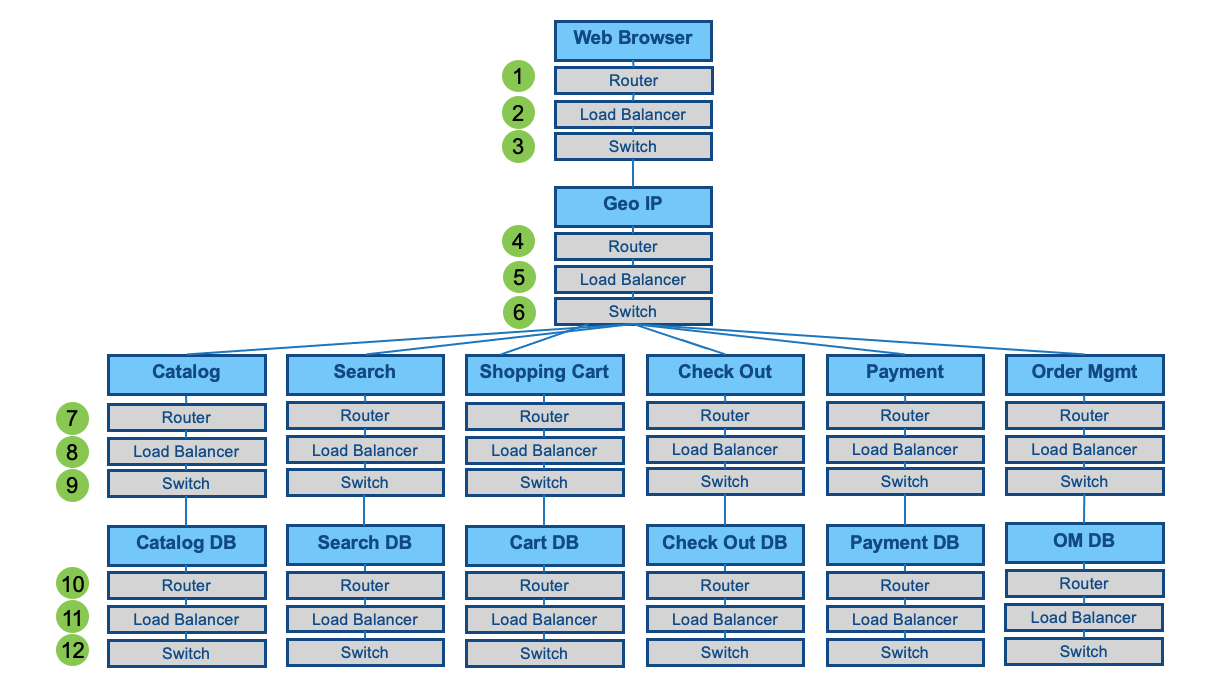
We have reduced the depth of calls or number of calls that behave in Series.
We cannot make this example yield Four 9s without adding redundancy. If we add redundancy, we add costs.
This math applies for any of our Anti-Patterns. Anti-Patterns behave in Series. Each connected service reduces availability. It likely adds 3 to the expected availability exponent due to the minimum number of network hops.
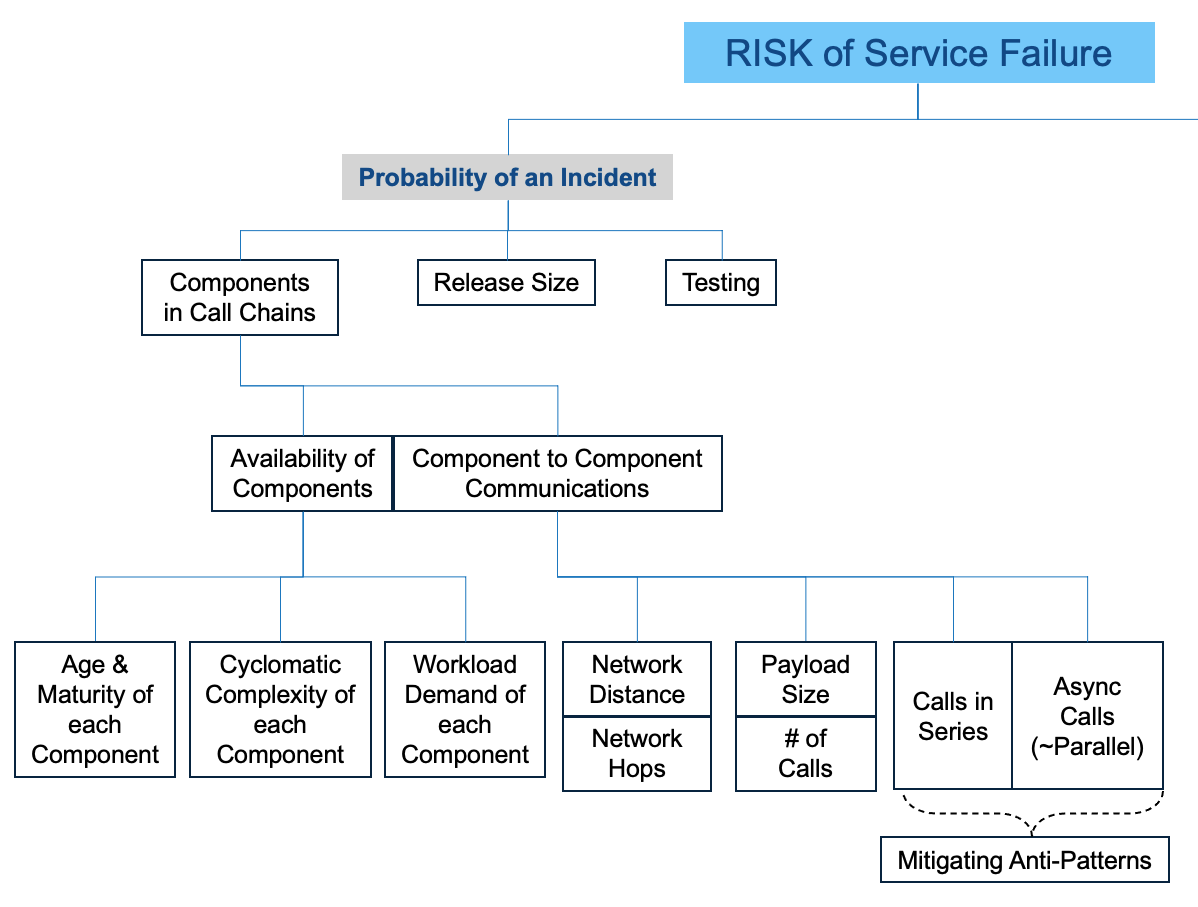
This math is why we often recommend Libraries to remediate Anti-Patterns. Engineers, developers, and architects discount the number and interaction of services calling one another. They are mystified when availability and response times are much lower than expected. The following is from our Availability Risk Model.
Estimating and Avoiding Downtime
Our AKF Availability Cube - helps simplify the math for expected Availability. Our cube identifies which components contribute to the base and which contribute to the exponent.
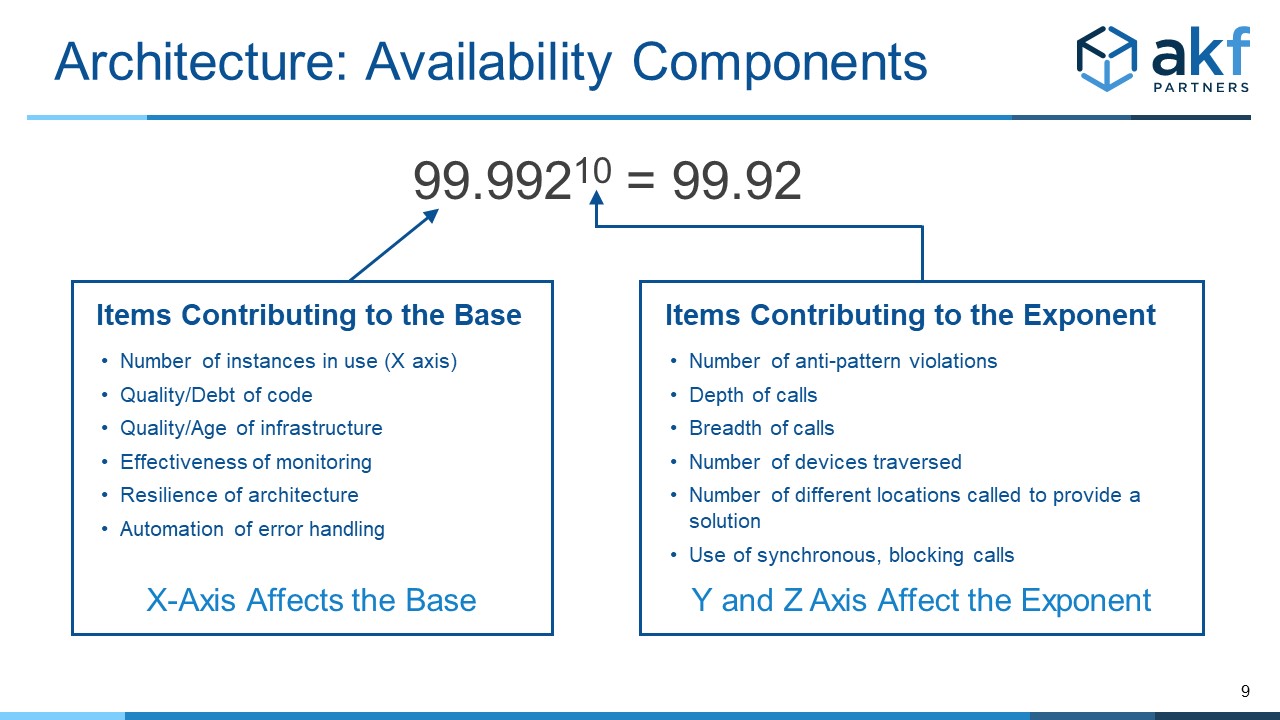
Our Anti-Patterns help identify where availability will be a problem (Y and Z above). Our Microservices Architecture Principles article walks through best practices.
Learn More
We cover these Availability topics and this example in all our public workshops. Yes, even those for Product Managers. Availability is a feature.
This YouTube video walks through this blog post and our AKF Availability Risk Model.
This Excel calculator walks through the above examples. The calculator shows the expanded version of each sub-component for you to adjust.
Contact us if you would like to learn more.