Many of our clients put in place OKRs to link their long term strategy to delivery. OKRs are Objectives and Key Results, or in AKF language 'Outcomes' and Key Results.
Unfortunately, many of our clients have lackluster results with OKRs. In our analysis, we find 3 high level problems and multiple root causes:
Wrong OKRs | Lack of buy-in | Wrong implementation |
Confusion of leading vs lagging indicators | No top-down ownership | Not doing the Alignment exercise |
OKRs do not reflect the current and/or desired business model | Execs do not understand top level OKRs | Co-mingling of OKRs with HR processes |
OKRs do not reflect the current and/or desired operating model | Too difficult to capture the most important metrics | Lack of company wide training |
Mixing in run-the-business KPIs | Patience - it is an iterative process | Not incorporating into other operational cadences |
We will go into each problem, root cause, and suggested remediation.
Wrong OKRs
Often times, the OKRs are not correct. This leads to wasted time and resources.
Confusion of Leading vs Lagging Indicators
This is one of the most common problems with OKRs. OKRs provide insight into whether the organization is on track to achieve its goals. OKRs are hypotheses of tens and hundreds of independent vs dependent variables.
The independent variable is the leading indicator and the dependent variable is the lagging indicator. We often see lower level Key Results that are not leading indicators. Often, all subordinate Key Results are lagging indicators.
One of the primary reasons people mix the indicators/variables is the ease of capturing the data. Outcomes are simply the company results. Results are often top line and bottom line financials.
Leading indicators (Key Results) often come from multiple systems. These leading indicators (independent variables) may not be captured today. If they are not captured, a stakeholder must manually capture this information. Eventually, this data capture and analysis needs to be automated.
Leading indicators are also difficult to isolate to validate they are correct. Not only is the leading indicator hard to find, analysis is needed to determine if changing the key result drives the outcome.
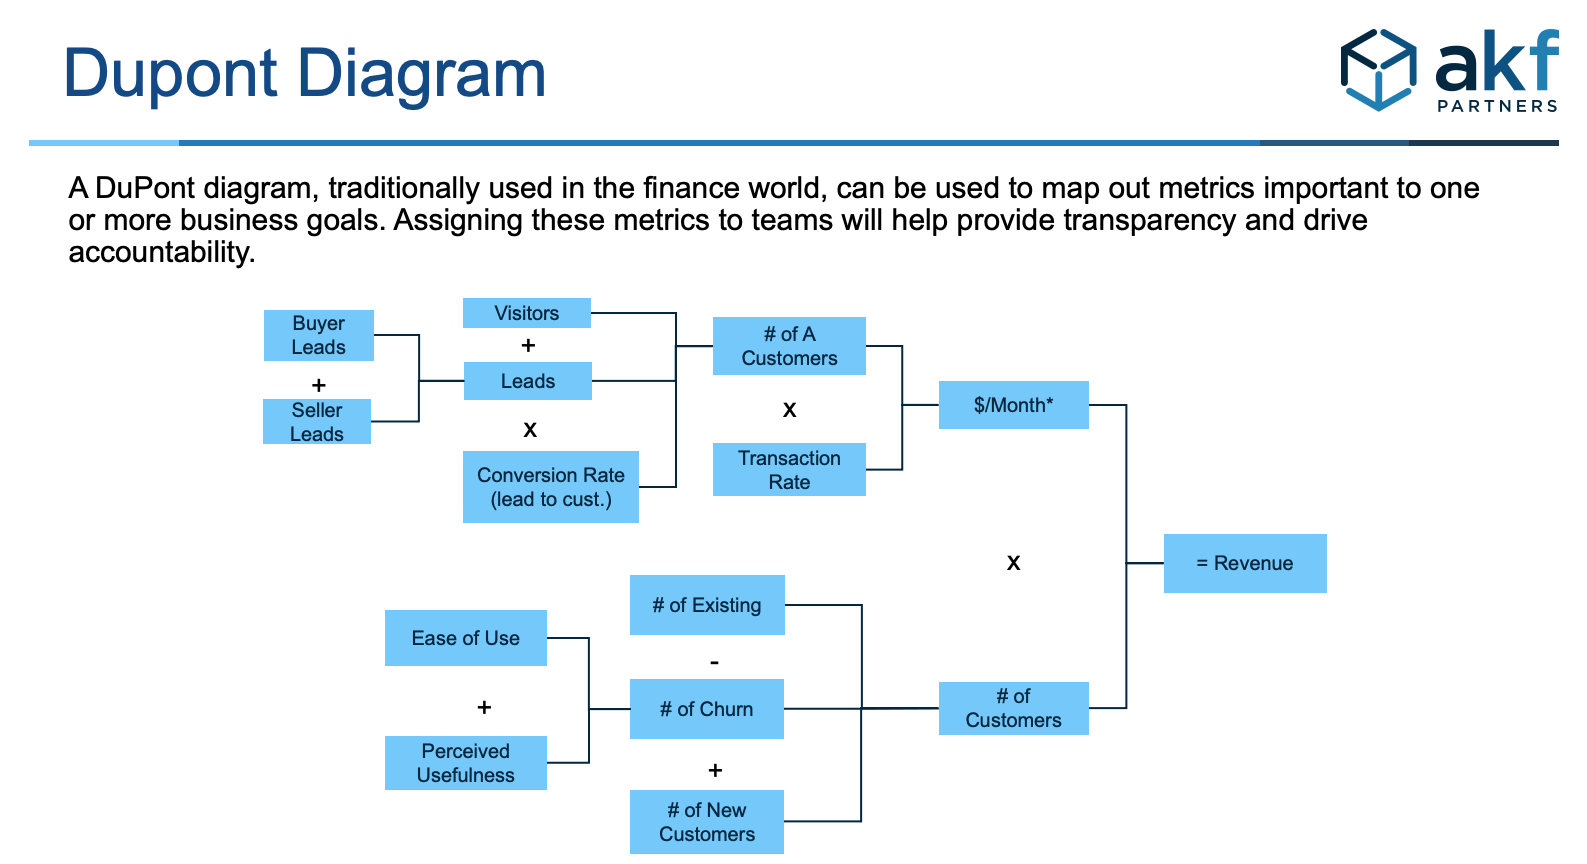
The approach we recommend to identify the right leading and lagging indicators is a DuPont diagram. DuPont analysis is most well known in the financial world. Similarly, a DuPont diagram visualizes the dependencies between various metrics to model how your business makes money. Dupont diagrams help visualize OKRs. OKRs are often tracked in multiple spreadsheets, spreadsheets, or databases. OKRs are also fully written sentences. This makes it difficult to understand the mathematical modeling of the leading and lagging indicators. DuPont diagrams remove the words and focus on visualizing the math. These diagrams make discussions easier and faster to hypothesize leading vs lagging indicators.

OKRs do not reflect current AND/OR desired business model
The goal of any business is to win in a market. OKRs are at their core a framework to win in the market. John Doerr's book uses the American football model to illustrate the framework.
Several Os or KRs must reflect the external market factors. We often see Os and KRs missing the competitive threats or market opportunities.
We do see our clients model a sales funnel to capture market share. But the Os and KRs often lack the context and details to capture improving key stages of the funnel. Funnels also lack the dependent vs independent variables. In short, the sales funnel is often incomplete and/or has a handful of lagging indicators.
Our recommendations to resolve this include:
- Restating the sales funnel as a customer journey map. Sales funnels are often lagging indicators. For example, measuring the number of prospects that advance to each stage in your CRM is a lagging indicator. Higher numbers at the top of the funnel may improve numbers at the bottom, but that is not guaranteed. Journey maps helps identify leading indicators, or the opportunities to improve each stage of the funnel.
- Identify the competitive threats against your OKRs. This approach augments a journey map and sales funnel to identify where you are losing prospects and customers. Journey maps are helpful to understand your prospect and their pain points. But, journey maps often miss how well you perform against your competitors. Competitive positioning documents and diagrams help refine OKRs
OKRs do not reflect the current AND/OR desired operational model
Where the previous mistake focused on external factors, this one focuses on internal factors. We often see OKRs that miss how the organization actually operates current state. This prevents stakeholders from identifying internal barriers and obstacles.
The common missing focus areas we see missing from our clients are:
- Architecture - the current architecture has technical debt or other issues. The leading indicators suggesting architectural issues are undesirable time-to-market, downtime, bugs, and costs. Explaining technical debt may require high level diagrams that illustrate strengths and weaknesses.
- Process - the teams may have inefficient or ineffective processes. Leading indicators suggesting process issues are undesirable cycle times and waste. Our CEO guide to Measuring Engineering Performance helps identify the KPIs that are important to your organization.
- People - the teams may be lacking talent or skills needed to improve outcomes. Leading people indicators are pulse surveys, exit interviews, and hiring success rates.
Mixing in 'run the business' KPIs
OKRs should help an organization focus on major improvements and transformations. They should not focus on basic operations - unless the organization needs to refocus on the basics.
OKRs are similar to WIGs (Wildly Important Goals). Co-mingling operational metrics into OKRs provides too many areas for the team to focus. This in turn makes it difficult to identify leading vs lagging indicators.
Operational metrics should identify deviations from normal expectations. But operational metrics seldom help identify how to win in the market or improve the operating model.
Note that OKRs reporting and readouts may be part of regular Operational Reviews. However, they should not be co-mingled as a concept.
Lack of Buy-in and Commitment
Another area of focus where OKRs fail to improve outcomes is organizational buy-in and commitment. The ADKAR change management model (Awareness -> Desire -> Knowledge -> Ability -> Reinforcement) helps explains some of the challenges. We'll to into more detail where we see lack of buy-in and/or commitment.
No top down ownership
OKRs are not effective if the executive leadership is not supportive and leading the charge. We do see companies where the head of Product (CPO) and head of Engineering (CTO) are driving OKRs. These companies do well, but they are suboptimal if the CEO and direct reports are not driving OKRs.
To avoid this scenario, the executive team should go through an OKR workshop to:
- understand how to implement the methodology
- understand how they reinforce good behaviors
- help executives overcome obstacles from their team
- to identify why previous OKR efforts may have failed
Execs do not understand the top level OKRs
Executives may be supportive but are missing the experience and/or skills to build and measure OKRs. The leading indicators for this situation are the wrong OKRs mentioned above.
The common concepts we see missing are:
- Strategic frameworks. Some members of the executive team are not familiar with various strategy frameworks which capture the market forces and describe the proper business model. Or, executives co-mingle these strategy frameworks and fail to utilize OKRs properly.
- Financial acumen. Some team members have more of an accounting focus vs a finacial focus. For example - "Where did we end up each fiscal period (lagging)" vs "How do we get better returns on our investment (leading)?"
- Operational concepts - this is common where executives may focus too much on final sales or costs. For example, a focus on cost/input vs cost/output could lead to spending on lower cost resources that slow time-to-market.
To overcome these obstacles, two to three key executive leaders should provide these mindsets when building OKRs. You may bring in outside consultants to assist with building OKRs, but full time employees should own and understand OKRs.
Too difficult to capture the most important metrics
Difficulty in capturing leading metrics was a common root cause for the wrong OKRs. It is also a barrier to commitment.
Leading indicators often come from more than 1 system. For entire OKRs trees, the source data spans dozens of systems.
Engineering is often needed to automate the extraction, cleaning, and merging of data to analyze for OKRs. This is a common problem in data and analytics. It is also likely a new effort for the current business intelligence / analytics team. The solution is to secure the resources for your business intelligence and analytics team to wrangle this OKR data and a team to help analyze it.
Patience - it is an iterative process
OKRs are a long term commitment. They are hypothesis driven. The hypotheses could be (and often are) wrong initially.
OKRs are not binary goals. They are a combination of goals on a 100 point scoring system. If you achieve 100% of your outcomes, you have likely identified the wrong OKRs.
Furthermore, the analysis is not static. The market is not static. Neither is your organization. The purpose of OKRs is to respond to dynamic conditions on a consistent cadence.
Wrong implementation
Another area where OKRs go astray is in the execution of a new company wide process. Companies that install OKRs already have other enterprise wide processes. These processes compete for employee's time and cognitive focus. Here are several missteps that we see.
Not doing the 'Alignment' exercise
OKRs are a mix of top-down and bottoms-up planning.
The top-down planning should align or guide the strategic direction of the company. As stated above, good OKRs are generally outward facing and focus on winning in the market.
Bottoms-up planning are generally inward facing or they reflect the internal operating model. These are the existing constraints that hold back the business's performance.
Companies that focus only on top-down or bottoms-up OKR creation often create the wrong OKRs. To avoid this, the alignment exercise brings together the top-down and bottoms-up planning to identify:
- cross team dependencies
- assumptions
- risks and issues
Successful companies have a mix of annual and quarterly planning cadences. The quarterly OKR planning should have a leader driving the alignment exercise. It is often part of 'Big Room Planning' for updating enterprise/product roadmaps.
Co-mingling of OKRs with HR processes
A common mistake is to combine OKRs with HR processes, particularly performance reviews. OKRs only cascade down to a small team. They do not cascade down to individual contributors.
Individual leaders and executives may own higher level OKRs. The ability of these executives to manage and lead their teams to improve OKRs is part of the upper level management performance reviews. But, the lowest level Key Results should cascade no lower than a single team.
There are 2 root causes for this mistake:
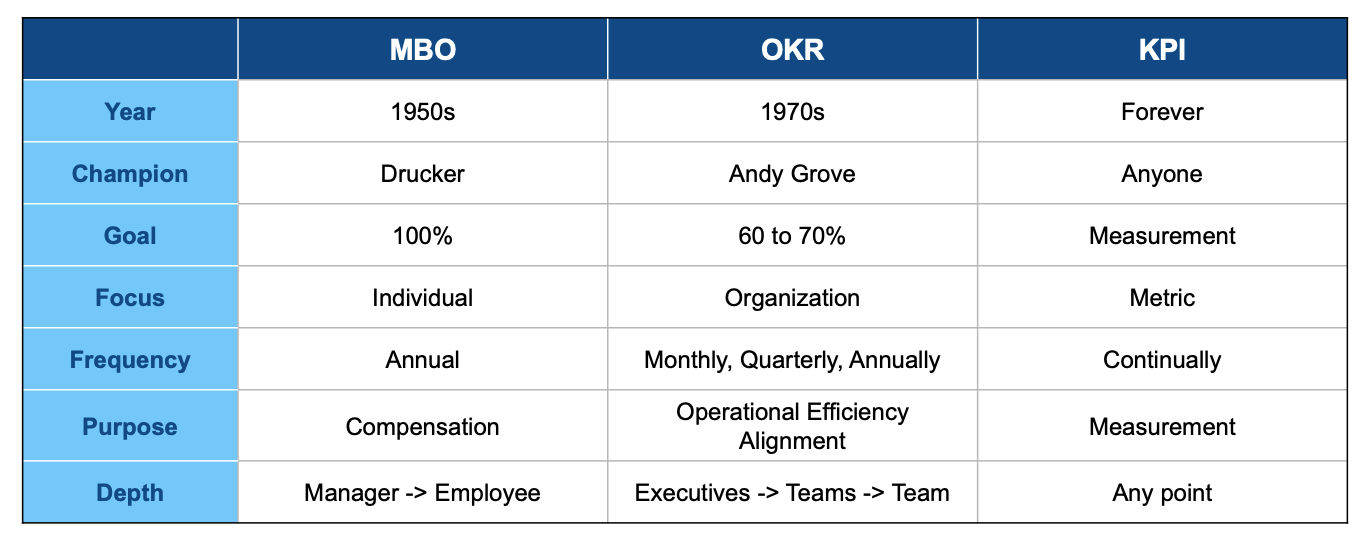
- Confusing traditional Management by Objectives (MBOs) with OKR concepts
- Combining OKRs with Performance Reviews because HR SaaS solutions offer both capabilities
The following table highlights the differences between MBOs, OKRs, and KPIs.

Lack of company wide training for OKRs
Good OKRs have executive sponsorship and team ownership. This often requires changing existing behaviors. To change existing behaviors, we recommend several training sessions:
- Introduction to the concept - this takes at least 1 hour, for each level of the organization
- Question and Answer session - this takes 1-2 hours, also for all levels of the organization. This should occur 1-3 weeks after the introduction of the OKR framework. Stakeholders of all levels will have specific questions how to change behaviors.
- Targeted training by level - start with executives to get the buy-in. Consult board members that have OKR experience to provide coaching.
- Annual refresher - provide a short review of the concepts to re-orient stakeholders.
Not incorporating into other operational cadences
Your current company likely has other operational cadences such as:
- annual and quarterly budgeting
- annual strategic planning
- operational reviews (monthly or quarterly)
- board meetings
All these processes consume executive mindshare and time. OKRs need to fit within these existing cadences. Some activities need to start while others need to change or stop. Identify what activities need to change before launching into OKRs. Revisit again every year.
Summary
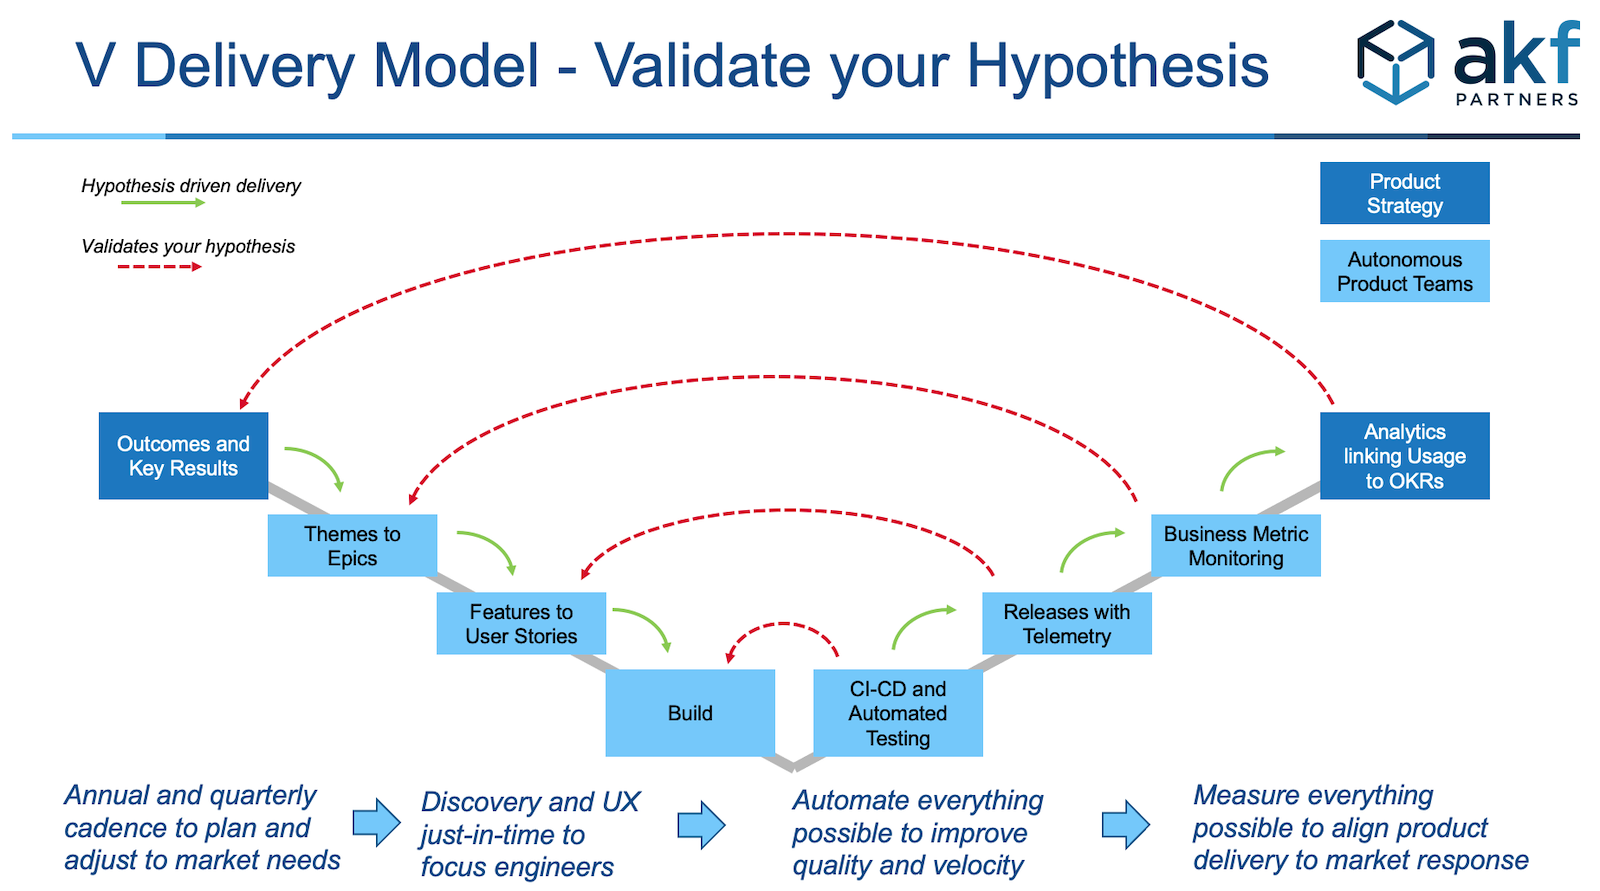
OKRs should drive Product Engineering and Delivery.
Our Validation (V) model illustrates how OKRs fit into Product Delivery best practices. The V-shape shows how to instrument your product/service to validate the hypotheses of your OKRs.

Our free Webinar covers OKRs.
If you need help implementing OKRs in your Product and Engineering organization, contact us.