We have been working with several clients attempting to improve their product and software delivery processes. One of the primary objectives for our clients was to move to Agile delivery.
However, these rollouts faced obstacles shifting to Agile. One of the primary objections was switching to Story Points. Teams were very comfortable estimating in hours – many have been doing it for at least a decade.
The switch from hours to story points is disruptive and requires a learning curve. Often times, the reasons why the teams should switch was not sold. As explained in the ADKAR change management model, many teams were stuck in the Awareness or Desire stage.
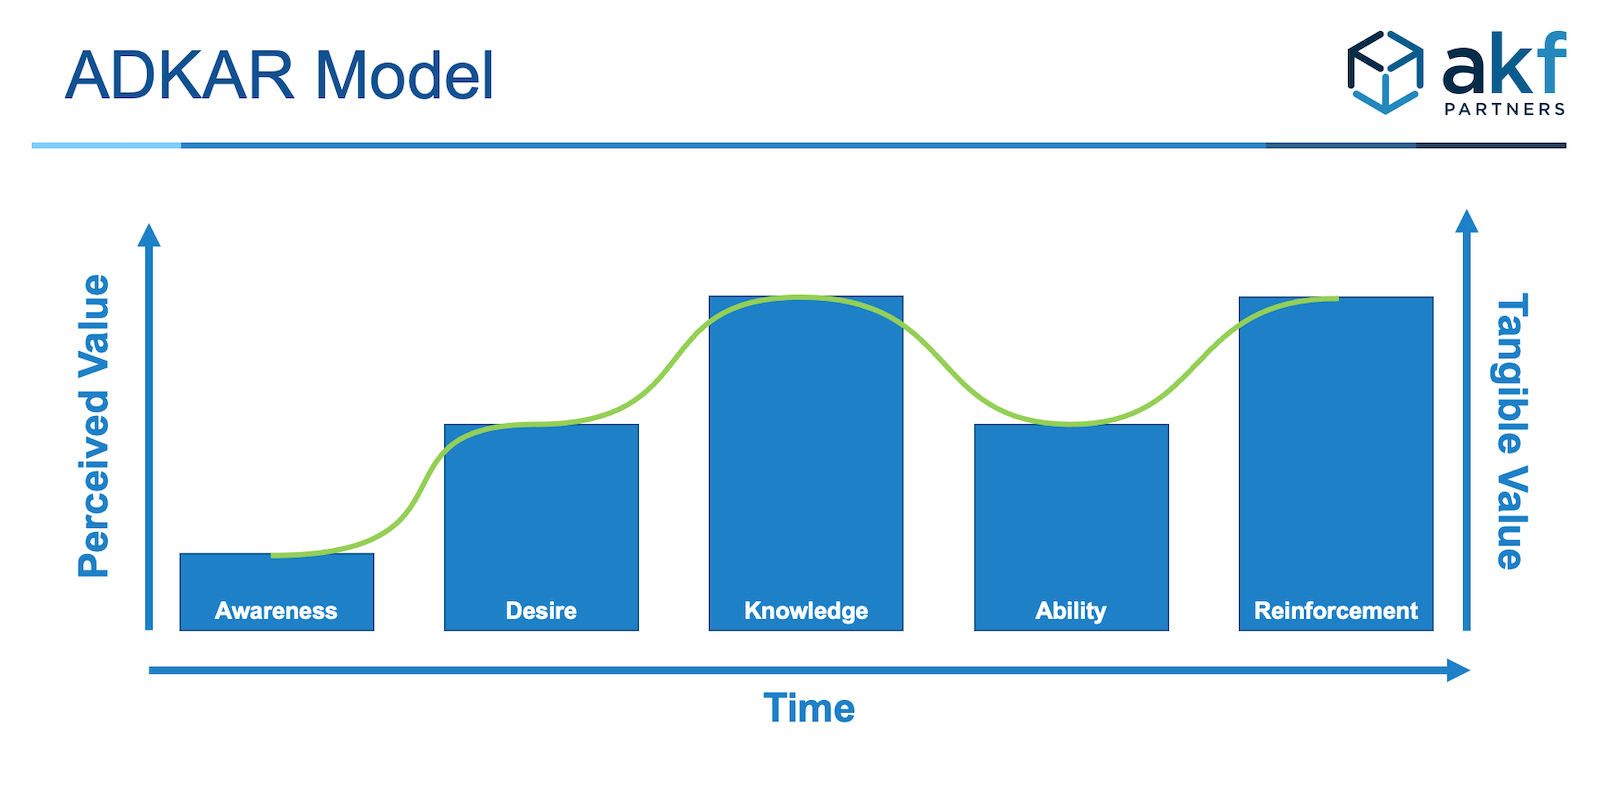
Awareness and Desire to use Story Points
In our advisory work, we recommend that CTOs and CPOs leverage Story Points for 2 high level objectives/outcomes (OKRs – see our article for common mistakes). Story points are the best way we have for Estimating:
- Velocity/TTM – your business stakeholders want to move faster. Story points provide a baseline for ‘velocity’ or how fast teams can deliver different types of work.
- Technical Debt – technical debt can be good or bad. The right amount optimizes several factors including availability, scalability, cost, and velocity (TTM).
So, done right, story points help prove that teams are moving at the right pace, and they help determine the right amount of tech debt to carry and pay down. Let’s focus on each one separately.
Reason 1 - Hours measure Time, not Velocity
To help orient various stakeholders (designers, engineers, system admins, team leads, product owners, etc.), we like to use analogies. In this example, we will use the example of Delivery Trucks to compare to Software/Product Delivery Teams.
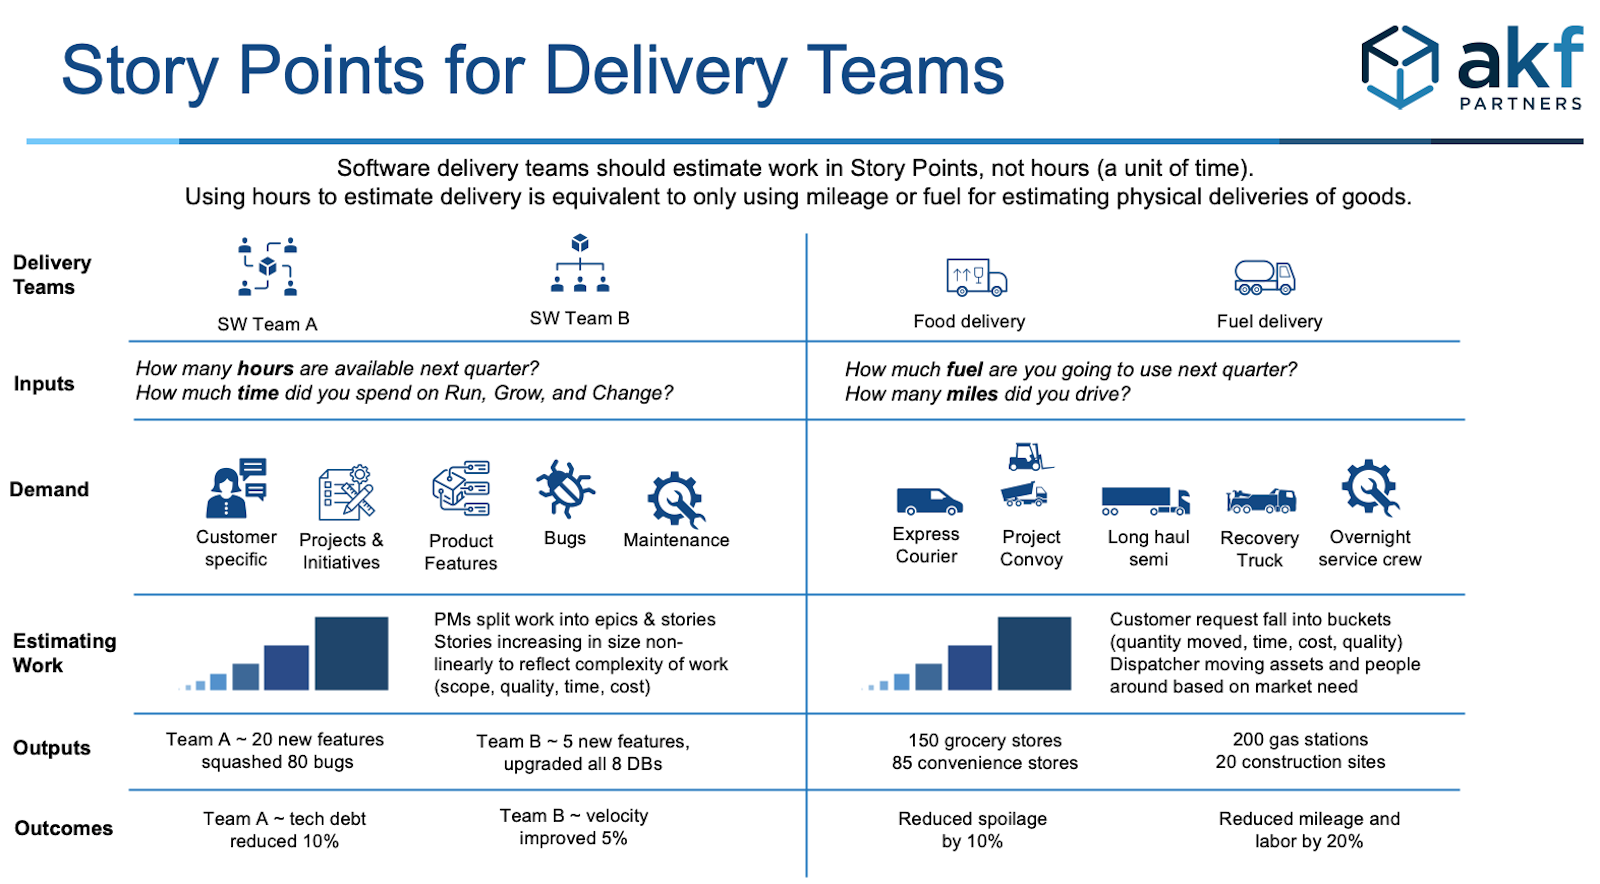
To avoid an objection that often comes up, we do recommend calculating hours at the end of a Sprint for various cost allocation reasons. But, we do NOT recommend using hours for estimating reasons with 1 very specific exception.
We use the table above to anchor and frame the conversation. At a glance, teams understand the challenges of hours to estimate how long it will take to deliver something.
However, other important concepts or variables help orient teams where the root cause barriers to story points may exist.
Let’s look at each one side by side:
Inputs – hours are inputs.
They can also calculate outputs. But they are not outputs or outcomes.
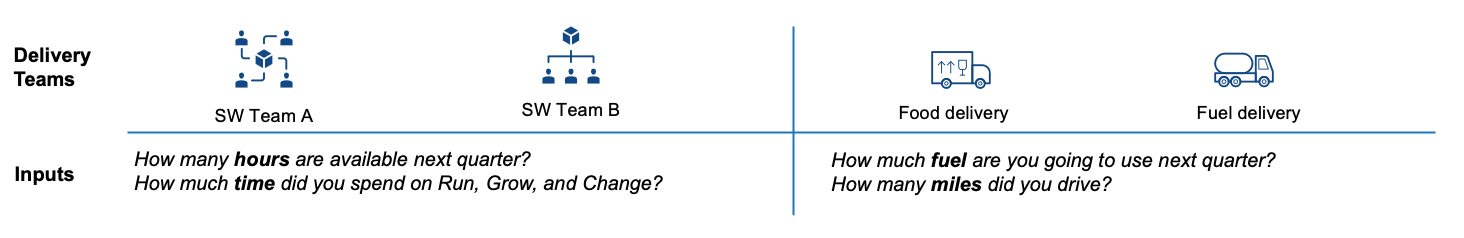
In the delivery examples, inputs are fuel, vehicles, drivers, distance for routes, etc.
Time is simply a variable or input the famous Project Management triangle/polygon: Scope, Cost, Time, and Quality.
Demand – are types of work to deliver products/services
Product/software delivery teams have different types of work demands. Whether they are front-end teams, full stack micro service teams, or specialized infrastructure or security teams, almost ALL teams have some mix of the 5 types of work.
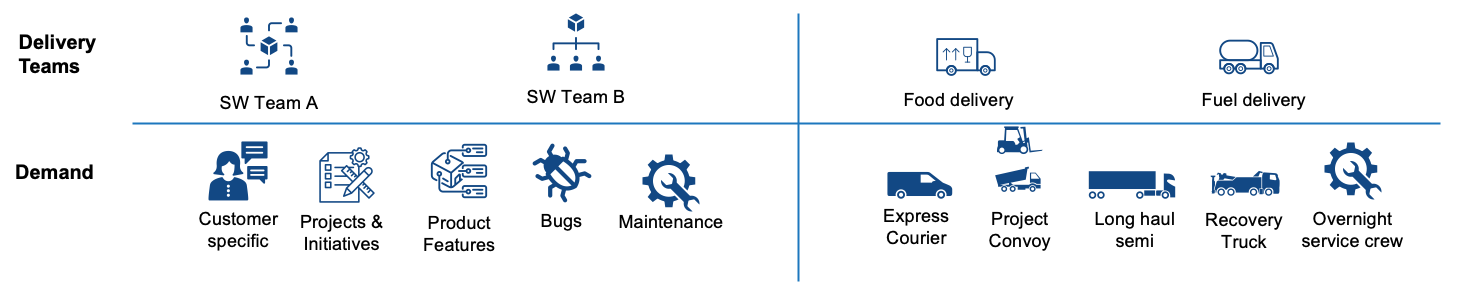
In any given Sprint or longer planning interval, teams are performing one of these kinds of work:
- Product features – these are the capabilities to win market share and wallet share. This is the primary focus of Product Managers/Owners.
- Projects & initiatives – projects are something the team has likely not done before. Projects need clear scope to identify a Start and End date.
- Customer specific requests – these may be unique to a specific customer or an early suggestion that can be incorporated into features for all customers. In general, product teams should minimize this work by shifting work to a professional services team or shift the work left via APIs.
- Bugs – in spite of your best efforts at testing, bugs will escape to production or other environments.
- Maintenance – this is the regular care and feeding of your system to support organic growth and the passage of time. We recommend 20% of the total effort for each feature/capability be set aside for maintenance.
For physical delivery of goods, whether fuel or food, has similar examples of the 5 kinds of work listed above:
- Shipping product features – these are the Long Haul Trucks. The trucks have regular schedules. They may take different routes, but they have a consistent set of rules for a schedule.
- Projects & initiatives – these are Convoy deliveries of food or fuel. In the food delivery example, think of a very large catering event for a big venue. In the fuel example, think of a buildout of a commercial real estate development and fuel needs to be delivered for a few months. These are not common, but they require careful planning because 3rd parties are often needed and coordination and sequencing is critical.
- Customer specific requests – these the urgent, one-off requests specifically for Couriers. Whatever delivery is requested, it may not be repeated for quite some time by any customer.
- Bugs – these are unexpected failures such as flat tires or drivetrain failures that need a Recovery Truck. Following the analogy more closely, these could also be errors in what was actually delivered. In either example, these need to be dealt with immediately and someone needs to deliver the right food, fuel, or replacement parts and resolve the issue.
- Maintenance – the ongoing work to prevent bugs and more serious work, often done by taking a vehicle out of service. Whether it is trucks or software, it needs maintenance to minimize the impact of internal failures or external market changes.
The analogy does not need to be perfect. The important step here is for each team to recognize:
- They are often doing all 5 types of work in a quarter or even a Sprint.
- Different techniques are needed to master any of the 5 types of work.
Software teams may identify longer term opportunities to minimize one or more of the types of work.
The important step is for each team member to acknowledge they need a way to quickly estimate these 5 types of work.
Estimating Work with Fibonacci Numbers
Teams sometimes try to T-shirt size vs using Fibonacci numbers.
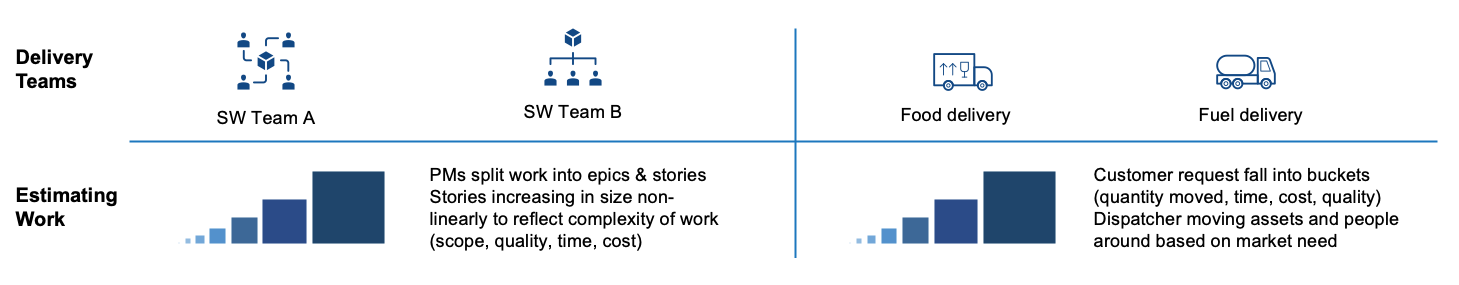
The reason Fibonacci numbers are important is due to increasing complexity of scope. Recall from the golden Project Triangle example, Time is only 1 of the 4 variables.
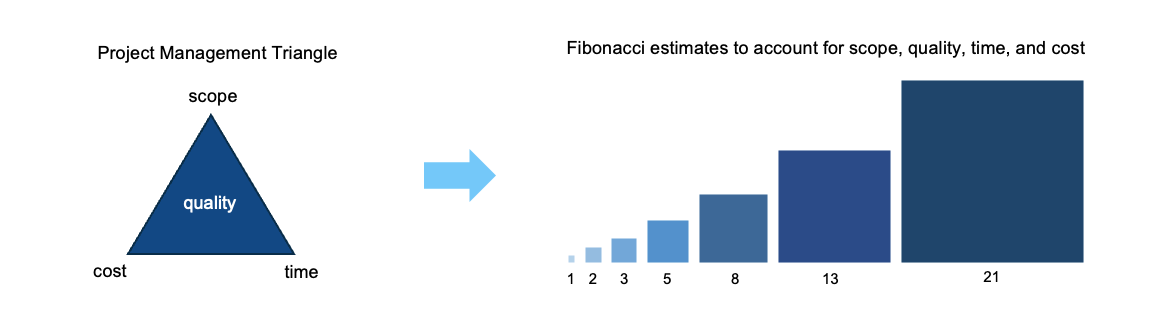
As Scope increases, time increases non-linearly due to the other variables of quality, effort, and resources.
Use whatever visual of a Fibonacci number you need to have team members visualize the increasing size.
The key assumption with Fibonacci Numbers is that you are using relative estimates. The goal of Story Points is for Teams (not individuals) to improve their estimating accuracy.
Over time, Product Owners become better at writing stories and splitting them up so that teams can quickly estimate them.
A good rule of thumb is that no User Story should take more than 10 minutes for a team to Poker Plan.
We often get asked if maintenance teams using tickets can stick to hours. We only recommend that if:
- Almost all work is small (less than 3-4 hours)
- They are not doing any of the other types of works (customer specific, projects) which often take more time and where estimates are likely to be wrong.
Using the fuel and food delivery examples, Dispatchers and Fleet Managers are tasked with very similar challenges to allocate resources based on demand. Effective delivery requires a mix of tools and human input from drivers, maintenance staff, sales, and customer support.
Outputs are What you Delivered
This example is straightforward. The key callout here is that each story needs to be tagged to know how many features were delivered, bugs were fixed, or maintenance activities were accomplished.
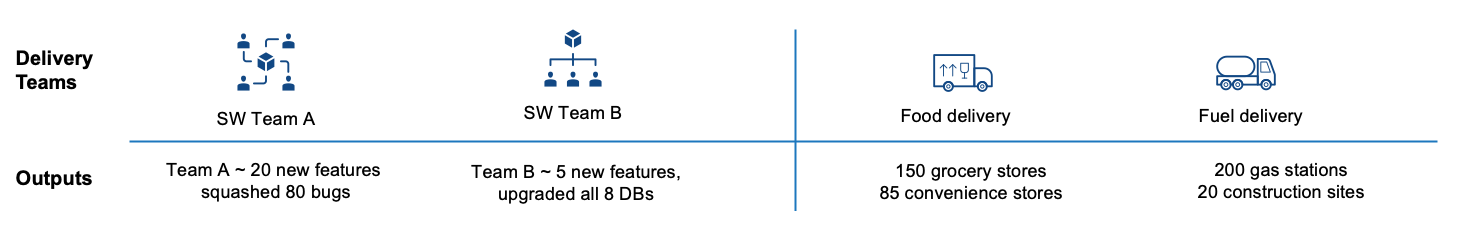
We’ll touch on this again when we get to Technical Debt. These Outputs are import Inputs to determining the right amount of Technical Debt for each team.
Outcomes are What the Business Cares About
The takeaway for teams is that Output does not equal Outcomes.
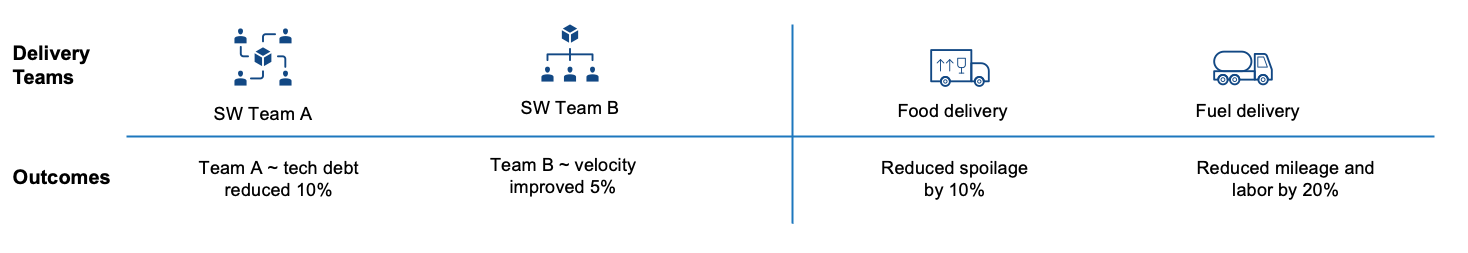
Outputs may inform Outcomes or one of the measurement criteria for an Outcome, but they are not Outcomes by themselves. Teams may be missing OKRs, or the OKRs may be wrong (see common OKR mistakes). At the very least, the Product Manager should create OKRs and have an Executive Leader provide feedback if they are the right or wrong Outcomes to improve and/or measure.
Reason Number 2 – too much Tech Debt slows Velocity, need to measure right amount Capacity to Pay Tech Debt
For most of our clients more than 5 years old, they have Technical Debt. For most of our clients more than 10 years old, they have too much Technical Debt. Very few of our clients can tell us how long it will take to pay off all their Technical Debt.
We believe the right amount of Technical Debt is good. To have the right amount of Technical Debt, teams need:
- A definition of what Technical Debt is (good or bad)
- A register/ledger of all Technical Debt
- A way to measure how we will pay for it
- A way to adjust it
The right amount of technical debt balances availability, scalability, cost effectiveness, and time-to-market. This is quick table to address each of the 4 items:
What is Needed |
Good Answer |
Bad / Incomplete Answer |
Takeaways |
Definition of Technical Debt |
|
|
|
Register of Technical Debt |
|
|
|
Way to measure how we will pay for it |
|
|
|
Way to Adjust |
|
|
|
Your target state is to shift from 2-3 buckets of Run/Grow/Transform to 4-5 buckets of New Features, Regulatory, Maintenance, Tech Debt, and Customer Specific.
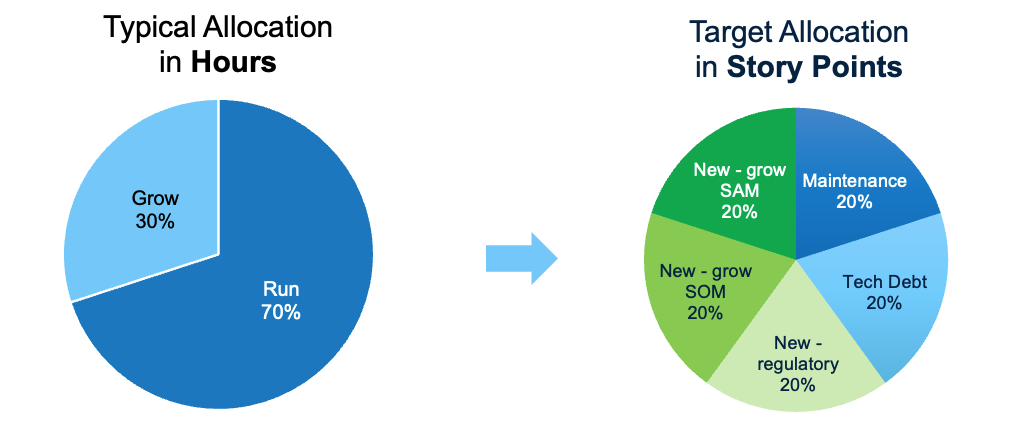
Report on this pie charts at least quarterly. And show them in the context of the other key variables and how they have changed over time:
- Availability – simple uptime or more granular by service and/or customer
- Cost Effectiveness - via some cost per unit
- Time-to-market – for major or minor steps in Product Delivery lifecycle from ideation to operations
Getting Help
If you need help shifting your teams to Story Points, please reach out. We’re happy to help.