Drawings Maps to Lead the Organization
Startups SaaS companies can easily link their business strategy to their SaaS or eCommerce architecture. However, as companies grow beyond a dozen employees and departments start growing in headcount, there is seldom one person that understands how to tie the architecture back to the ever-evolving market.
The executive leadership team of a B2B, B2C, or B2B2C company is frequently managing several concepts in isolation. That is, one person is responsible for Strategy, one for the Customer Journey, one for Product/Market fit, and one for the Architecture. Another person may be responsible for Competitors and another person may be response for Partners.
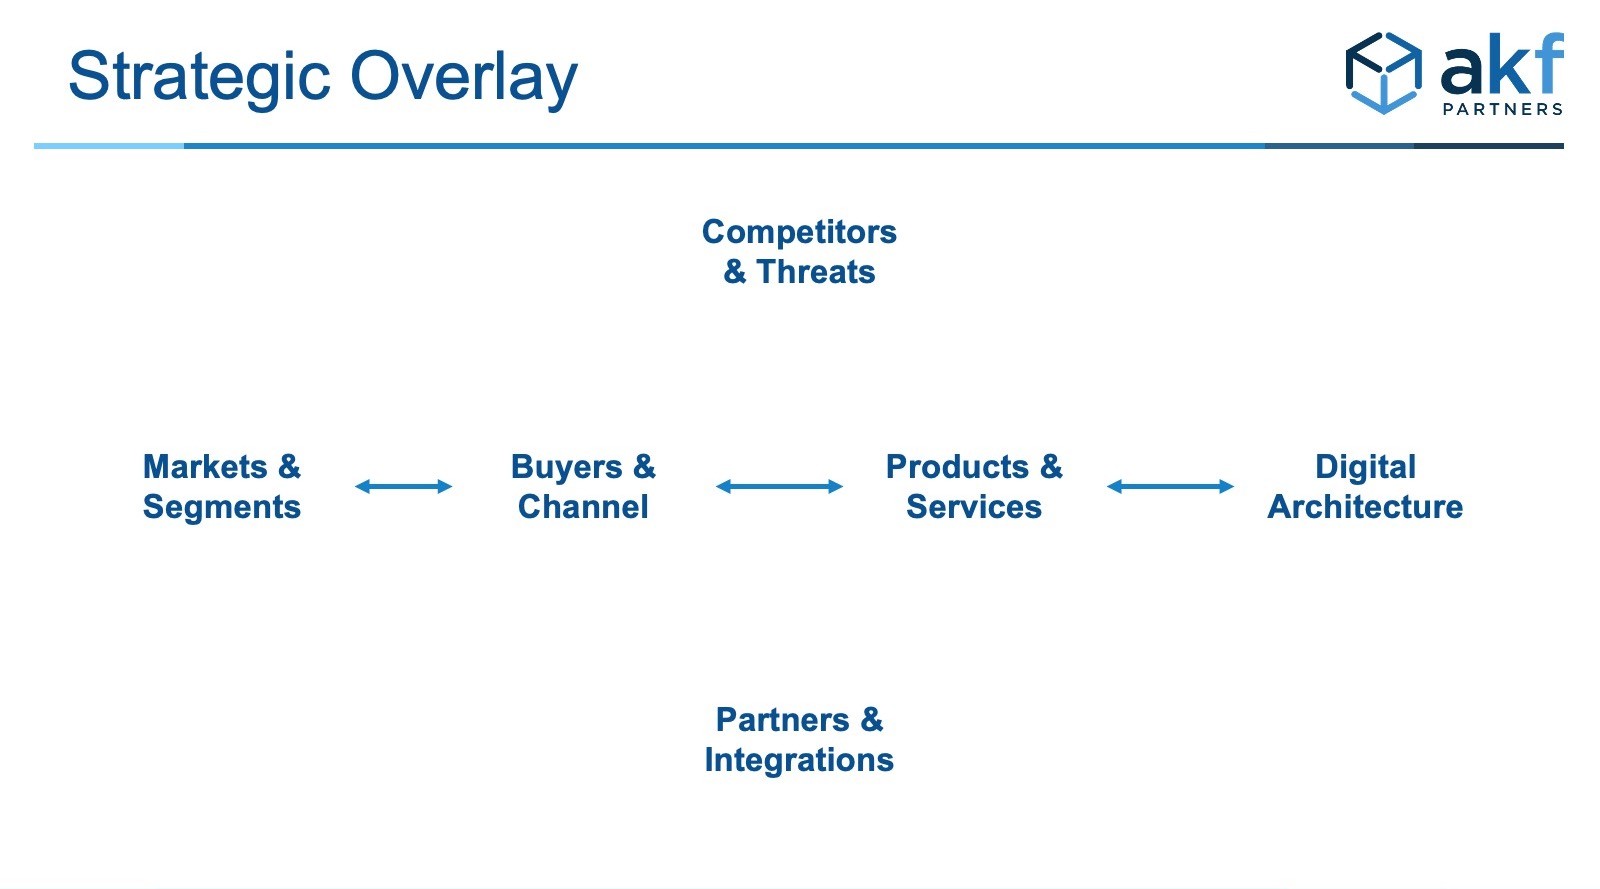
By looking at each concept in isolation, teams and leaders frequently have conflict that slows the organization.
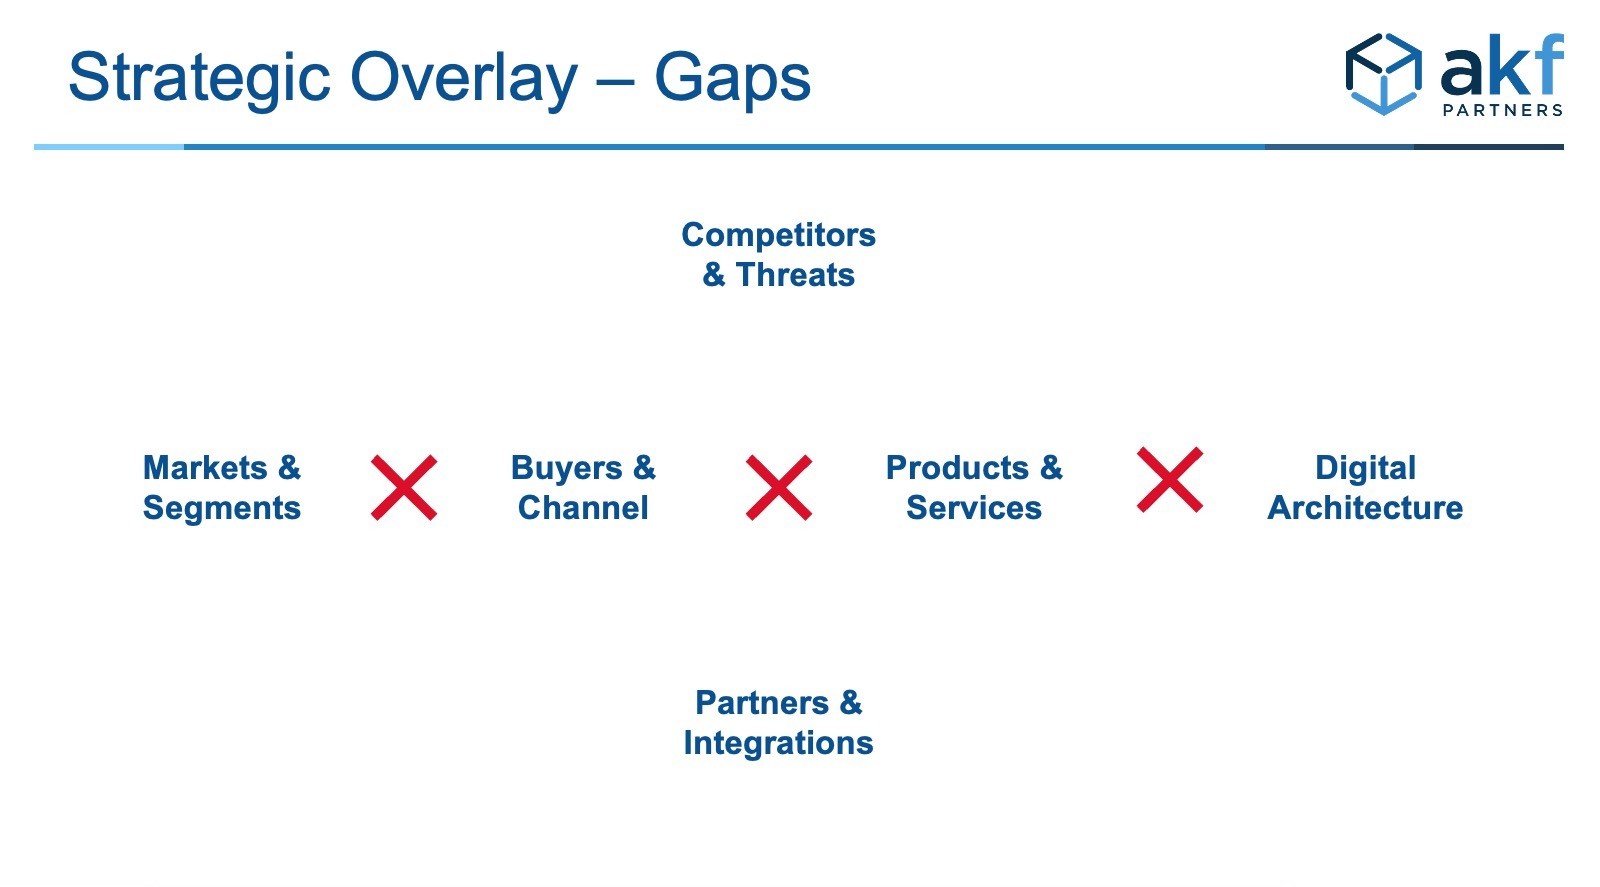
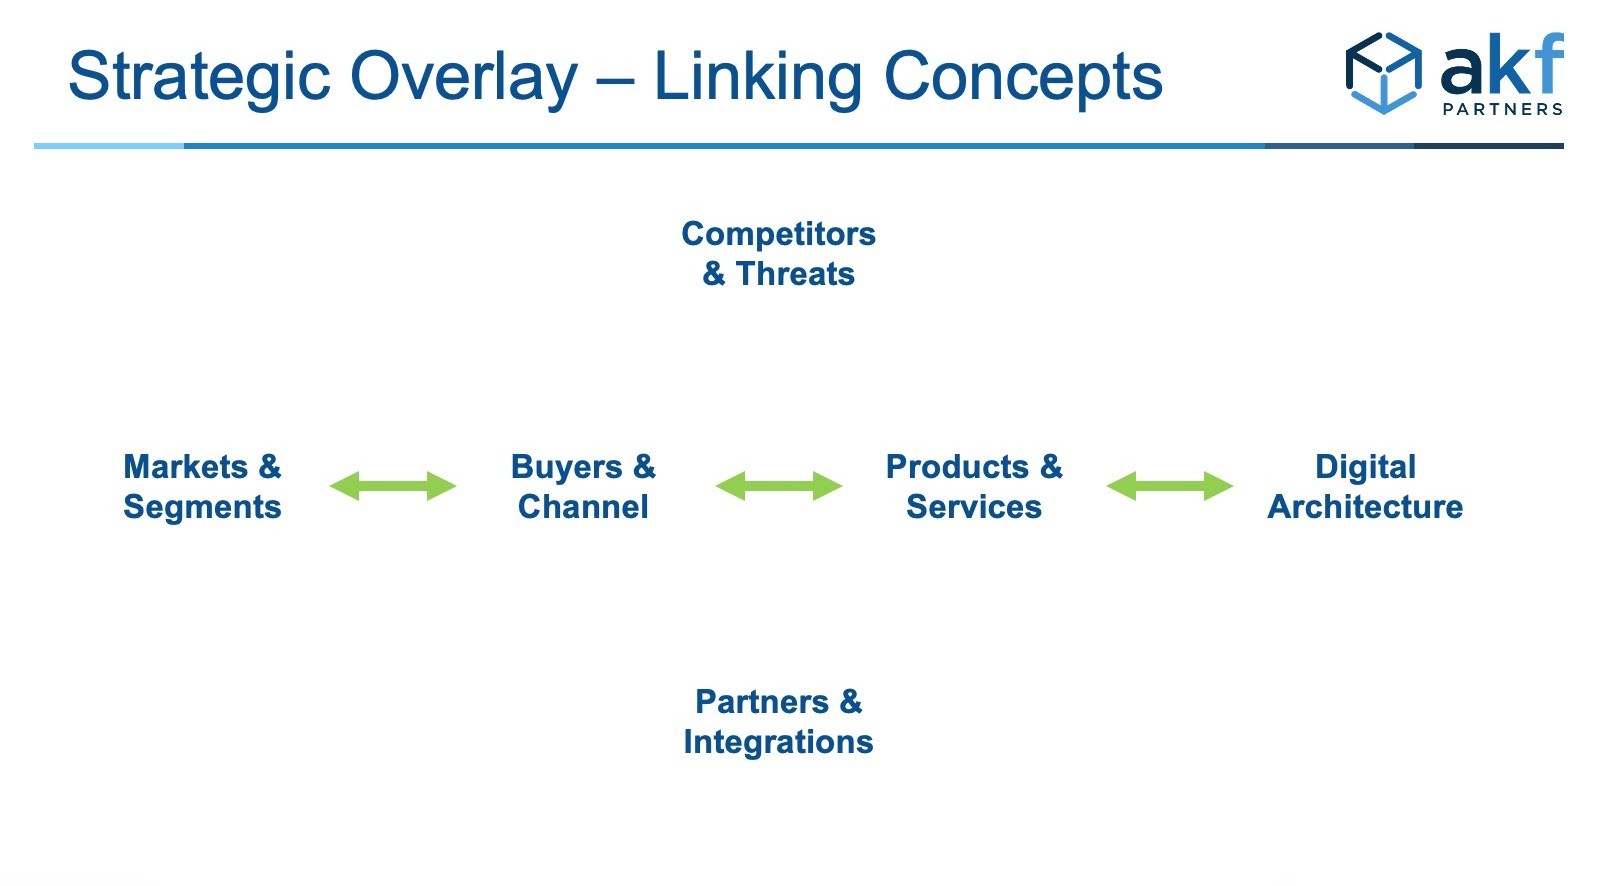
This is the undesired Affective Conflict. To avoid this type of conflict and align engineering teams and the architecture to the ever-changing market, we recommend linking these concepts together. This linkage helps identify ownership. By using the right artifacts, each owner can coordinate with other leaders to get on the same page.
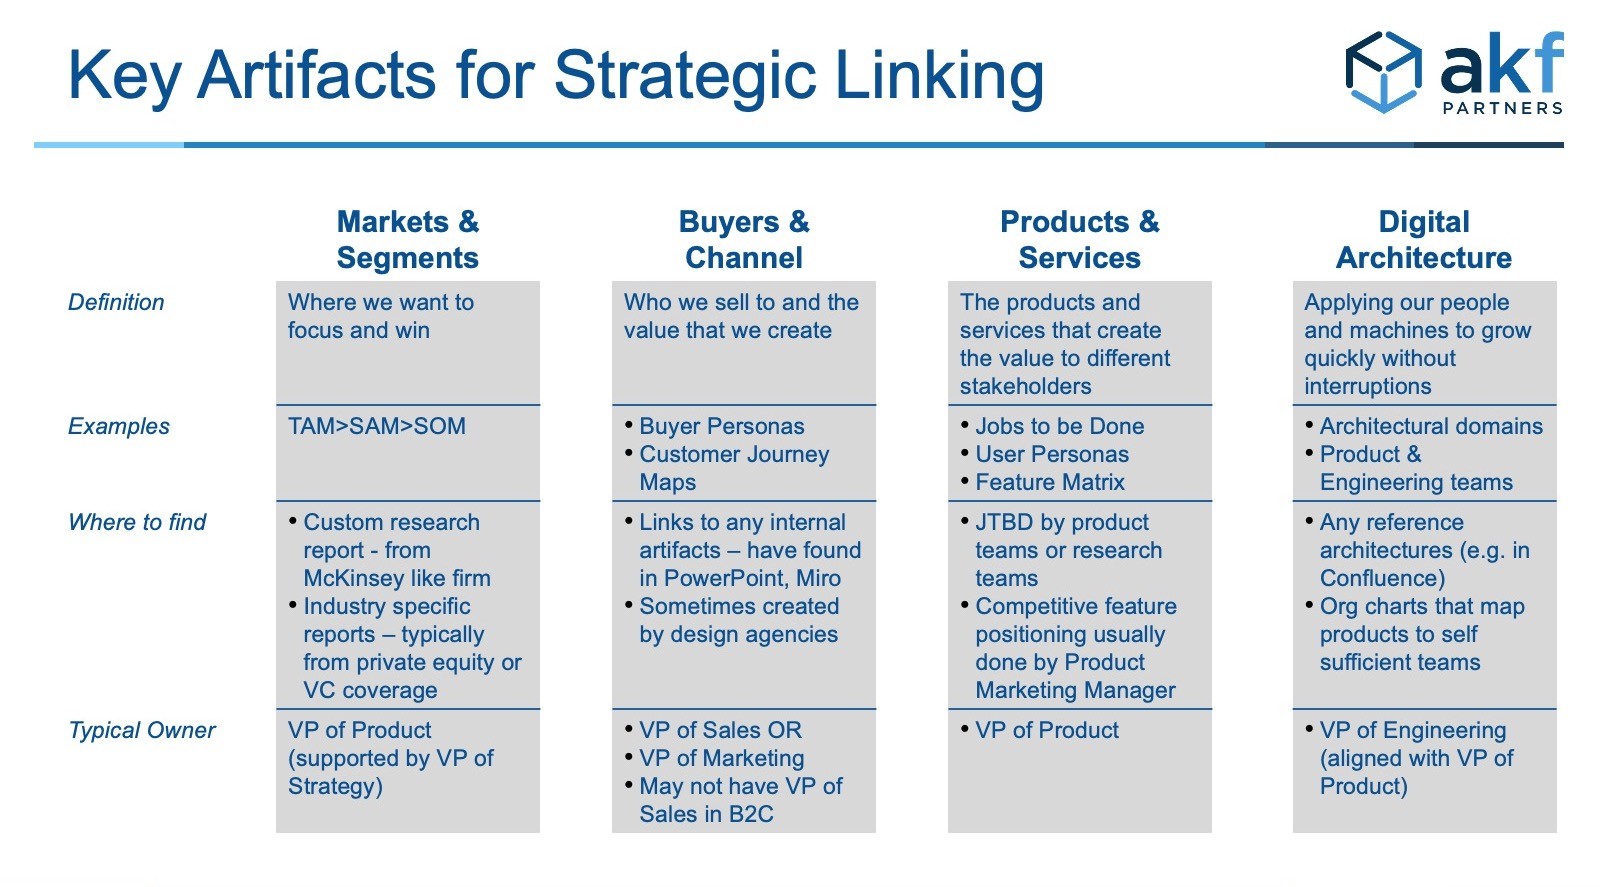
With dozens of strategy and architecture frameworks and artifacts, we have found a subset that help our clients get on the same page (literally):
- Business Model Canvas and OKRs – the Business Model Canvas is the simplest version that we have seen that explains the business strategy to the largest number of stakeholders in a single page. OKRs are the operational processes that validate the Business Model.
- Relationship Journey Maps & Buyer Personas – these are the best tools we have seen to get marketing, sales, operations, and product coordinated through dozens of touchpoints.
- Jobs to be Done and User Personas – this framework helps product teams understand the value that can be realized by the end users when the software is fully utilized.
- Feature Matrixes – this is typically captured in a spreadsheet or similar database that organizes features into modules. Although difficult to fit into 1 printable page, the matrix should expand and collapse to enable a summary view on 1 page.
- Architectural Diagrams – preferably one that references a Feature Matrix and one that represents a Journey Map. If drawn properly, both concepts can be identified in a single very large drawing.
In a series of upcoming blog posts, we will provide examples and best practices to make these artifacts easy to understand and link to related concepts.
For each of these concepts, we recommend the following owners that maintain these artifacts, models, or maps.
For all of these artifacts, we have several recommendations when and why to use artifacts to model these strategic and tactical concepts:
These are Mental Models
The models are designed to get different stakeholders on the same page for collaboration and communication reasons. They should do their best to reflect reality while understanding simplifications are needed for casual observers.
Models get out of date quickly
The model typically reflects current state, and possibly a desired future state. As such, spend the minimum amount of time to get the maximum amount of detail. A good model should be created in 2-6 hours with the right stakeholders and an experienced facilitator.
Models should fit on 1 big page/screen
Think of 11” x 17” piece of paper or a 60” 4K TV for most of the aforementioned models. You may be using more advanced drawing & collaboration tools such as Miro, Figma, or Visio. You don’t want readers flipping pages or viewers constantly jumping around artistic boards. You can use additional pages for details and to build the summary view. But you need a final version that is viewable in a medium to large format.
Be careful trying to cram the model into a PowerPoint – you will likely need to use animation if your PowerPoint gets busy with boxes & arrows. Some artifacts, typically the Feature Matrix and Competitive positioning, will be managed in Excel. Use Pivot Tables or the Group By feature to be able to zoom out to a view that fits on 1 page.
Create models when you see confusion, conflict, turf battles, or politics.
We frequently hear from clients that ‘X is a political issue’. We find in many cases people are using words when they need drawings. People are comfortable using words in heated exchanges because they are typically reacting to a single observation that lacks the context of the big picture. We find that the same people who become defensive (or offensive) behave completely differently when a narrator is walking others through a drawing. This is where the more desired Cognitive Conflict helps the organization focus on winning in the market.
Create/update these models before and after M&A
Mergers and acquisitions are typically short duration efforts during the buying process but very long duration during the integration. We find many companies struggle with integration strategies and execution because they lacked several of these mental models to connect Strategy to Marketing/Sales to Operations to Product to Architecture. By mastering how to create these models in 2 to 4 hours, your M&A pricing, strategy, and integrations will all improve.
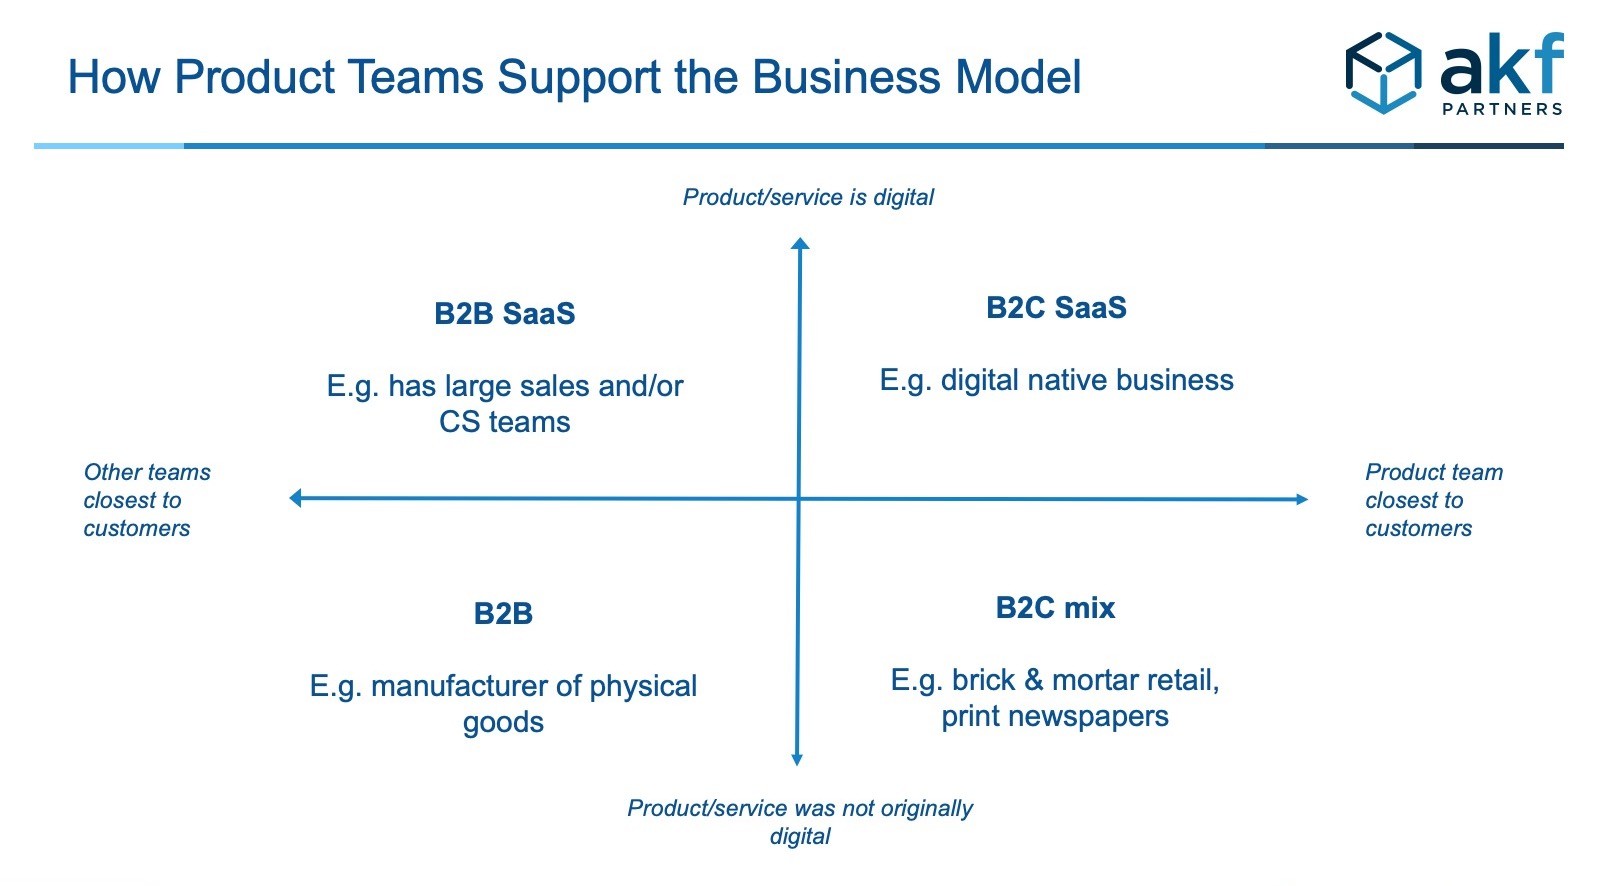
These models work well for B2B and digital laggards in B2C
We find a lack of coordination when the Digital Product team is not closest to the end customer or where the core product/service is not Digital. In B2B SaaS companies, the sales, marketing, and customer operations teams work directly with prospects and users. This situation is also common in B2C players that were not digital native – e.g those that started in brick & mortar retail or analog businesses such as print newspapers.
If you need help getting your leaders on the same page to connect your Architecture to your Strategy and Market, reach out to one of us.