
What are Engineering Team Performance metrics?
To CEO’s, especially those with a non-technical background, the Engineering organization can be a bit of a black box. That black box likely creates a lot of value and in companies where software is the primary product then the work the engineering team does literally creates the product itself.
So, if engineering is a human powered black box, then how do we pull back the covers to objectively evaluate if the engineering team is working optimally to build new product capabilities? Putting transparent metrics in place that map to desired business outcomes and monitor how those metrics are improving (or not) over time is the best place to start.
In short, having key engineering metrics that business stakeholders understand and agree upon goes a long way to building and maintaining trust. This allows for talking in concrete and commonly understood terms about the health of the engineering team and focuses on improvements that are the most impactful for the business.
We recommend that the top-level metrics that are shared at the senior level are a short list, ideally 3-5, but supported by additional detail (other metrics) where appropriate. For example, if the team is putting a focus for improvement in a given area, then they may report additional metrics for a period of time where intensive effort is deployed to make the necessary improvements – and then stop reporting this metric at the senior level when it has reached its targeted level of improvement.
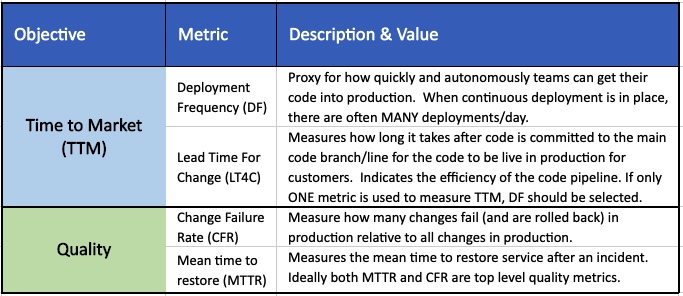
The following table summarizes key metrics to consider, mapped to relevant business outcomes and recommendations for consideration as a top tier metric. We define a top tier metric as one that is reported periodically at the senior stakeholder level (C-level, head of business unit, board level in some cases).
In addition to the top tier (sr executive level, including Business leaders) there are a number of key metrics that are useful to monitor within the Engineering team and up to the CTO. A detailed list of metrics is included at the end of this article for reference.
The four metrics below are metrics created by the DevOps Research and Assessment (DORA) Team based on extensive research of 1,000's of engineering teams.
Why are Engineering metrics important?
If you are in business, then technology is likely important to your business (certainly at scale). Therefore, it is important that you take a disciplined approach to understand how your technology team is performing and how they are driving continuous improvement. This becomes increasingly important as a team grows, since managing with data is critical for any sizeable organization.
Metrics also become more important as a team scales. You cannot efficiently improve what you are not measuring! And engineering leaders cannot effectively run a team at scale without scaling their ability to understand with metrics.
Metrics should also be of value to the engineering team members (i.e. metrics are not just to make management ‘feel better’) and help them focus improvement effort over time. There are, however, some metrics that are used more by management and less at the engineer or scrum team level. In the case that metrics are more so for management’s purposes (e.g. time tracking metrics), then the leadership team should be very clear and deliberate in explaining ‘the why’ behind the metric and the value to the team overall (e.g. for time tracking – to help manage priorities and justify the appropriate staffing level for the workload)
Key points for CEOs and board members
- Minimize top level Engineering performance metrics that are viewed at the exec and/or Board of Directors level. It’s important to keep the list short, simple and focused for the metrics to have impact and not become noise or something that is glossed over regularly (Note that Security metrics are regularly reviewed at Board meetings. This is expected but note that the Engineering performance metrics in this article are not Security focused but are relative to overall engineering performance in building new products/capabilities)
- Although the list of Engineering performance metrics shared at the executive level may be short, the executive team (Business heads in particular) should have a high-level understanding of the operational rhythm of the Engineering team (e.g. what additional measures does the team have in place, where are they focused for improvement/evolution).
- Many metrics regarding product quality, stability, reliability and performance may be owned by Engineering but they should be shared with Product Management as it relates to incentives and measuring team performance. When these metrics are not shared with Product it creates team misalignment and breeds affective (bad) conflict as Product normally over-rotates to feature-factory mode and Engineering does not spend enough time on the aspects of the product that ensure ongoing quality.
- Take the time to align on not just the metrics but the vernacular and language used to describe them. It is also important to educate all executive stakeholders on what the metric is and why it is important, remembering that much of the executive audience may not have a technical background.
- Keep in mind that metrics can be leading indicators before something happens or lagging indicators after something already has happened. Although most metrics are lagging, where possible leading metrics are more powerful for timely impact.
- Metrics should always tie back strongly to an important Business outcome. Conversely if they cannot be tied to a meaningful outcome then they are likely not worth measuring.
- The Engineering performance metrics published at the executive level should be a small subset of what metrics engineering is measuring on a regular basis overall. Engineering teams should conduct regular operational reviews for the expanded list of metrics, usually in between ~monthly and quarterly. Key executive stakeholders should be aware of this operational rhythm and the level of discipline within the Engineering team.
- If there are quality issues or other concerns, it is helpful to do a periodic third-party review of the Engineering teams capabilities overall and benchmark/coach as appropriate.
Common CEO questions about Engineering metrics
What does good look like?
The definition of “good” for a given metric depends on the Business's needs. For example, a mission critical application in the finance or transportation sectors may have high resiliency requirements and release less frequently than a consumer or social application.
Most importantly, the Engineering team should have meaningful business relevant metrics they are using to guide execution as well as to drive continuous improvement, and that appropriate metrics are transparent and available to stakeholders within other groups Engineering collaborates with regularly (e.g. Product, Customer Support) as well as to upper management.
My CTO is not good at instilling operational discipline (including metrics), what do I do?
At a minimum, the CTO should understand the value of metrics as a guide for managing engineering performance and improvement at scale. This is a table stakes requirement, especially for larger teams. Assuming the CTO has this level of appreciation for the importance of measuring performance objectively, an operational metrics program can be coordinated out of a Project/Program Management Office (PMO) within the Engineering team.
Some organizations also have success with assigning Operational Leads (often out of the PMO or an operational excellence function) to work with a small number of scrum teams ongoing to help them navigate, implement, understand and improve their operational capabilities overall, including metrics that guide this journey.
What Engineering performance metrics are not
Engineering metrics unfortunately do not guarantee nor “predict” Product Business success in the marketplace
Engineering metrics generally are focused on how products are created as opposed to what product is created. It is equally important to measure and closely monitor product adoption and usage. The approach to measuring product success in the marketplace is normally managed by a Product Operations function within Product Management. It is also common to share objectives (aligned to incentives/bonuses) between Product, Business and Engineering regarding the Products’ success in the marketplace.
Engineering metrics are not "the be all and end all” of Engineering excellence – they are a guide
Like most things in life, metrics cannot tell you in perfectly black and white terms if your Engineering function is healthy and mature or not. For example, there are many aspects of architecture, such as service-to-service interactions within distributed microservice architectures, that can’t be directly measured or quantified. Therefore, it’s important to be aware that there are important aspects of the product that can’t be directly captured by a metric. However, focusing metrics on important business and customer outcomes can certainly help get at these other derived aspects of a healthy, well architected product. In the previous example of anti-patterns in service-to-service interactions, metrics such as uptime and failed transactions help to surface underlying issues that cannot be directly measured.
AKF regularly helps Engineering teams improve their operating discipline! Please contact us and we can help.
The table below includes additional metrics that cover the key dimensions of an Engineering teams' overall performance. These are metrics to consider for Engineering leadership at the team level and would normally be measured on a regular cadence and used to guide improvement focus on an ongoing basis. As previously described, some of these metrics may be 'elevated' periodically to share with Business stakeholders regarding strategic improvements but normally would be used more-so monitored and used internally within the Engineering team.
| Objective | Metric | Description & Value |
| Time to Market (TTM) | Deployment Frequency | Proxy for how quickly and autonomously teams can get their code into production. Is one of four core DORA metrics. |
| Lead Time For Change | Duration of time it takes after code is committed to the main branch until it reaches production (customers). Indication of automation vs. manual intervention. Is one of four core DORA metrics. | |
| Engineering Cycle Time | Measures how long it takes for a story that is prioritized and ready to be worked on in an Engineering teams' backlog takes to get from Prioritized in Backlog to coded, tested and in Production. This is an indicator of complexity in making changes to the code base as well as the size of changes being made on average. | |
| Eng team velocity in story points | This is another indicator of engineering flow. Ideally a single scrum teams' velocity is relatively constant and may improve over time (with experience level and team cohesion) | |
| Quality | Change Failure Rate | Measure how many changes are successful deployed (with adequate quality) in production. Quality = the change works and does not end up getting rolled back. This is one of the four core DORA metrics. |
| Mean time to restore | Measures how quickly a service is restored after an incident/issue in production. Is one of the four core DORA metrics. | |
| Availability | Measures successful transactions as a percentage of total transactions, or successful transactions as a % of total expected successful transactions over a given time period. Availability is more important than overall Uptime since Uptime assumes all time periods are of equal value, which for most products is not true (failures during peak traffic times are more impactful). | |
| Uptime | Reliability measurment, the time the application was available relative to the total time it's expected to be available and often a required contracted SLA. An uptime of 99.99% for example means a system is only down for 52 minutes and 35 seconds a year. | |
| Error Rate | Number of legitimate errors found in application logs over a period of time as a percentage of total transactions in the period. Setting an Error Rate threshold creates a natural objective agreement point to make trade-offs relative to change velocity and stability/quality/scalability across teams. Some organizations will set an Error Budget and stop new changes to production if the budget is exceeded in a given timeframe (new changes are not allowed then until the application is deemed too be stabilized/back to a good quality level overall). | |
| Defects in Production against SLA | Bugs in production should be measured and be transparent to Engineering and Product with the level of effort to resolve them specified in the SLA. Metrics in this area should include defect leakage to production as well as time to close relative to their SLA. | |
| Problem Closure rate by priority against SLA | Problem closure is the MOST important part of the postmortem process in terms of not repeating the same incidents over and over and should be monitored at a daily/weekly (i.e. frequent) cadence, and against the SLA for the priority of the problem tickets. | |
| Defect rates in each phase of the product development lifecycle | This measures the defects found in each phase of development through deployment. Cost to fix a defect generally increases by an order of magnitude from one phase to the next (e.g. design, development, testing etc.), so it is useful to understand the profile of defects introduced throughout the cycle (even for Agile cycles), in order to reduce defects in total and find them earlier in the process. | |
| Customer Satisfaction | Commonly measured by Net Promoter Score (NPS) or similar. It is important that Engineering and Product teams closely monitor the actual user engagement and satisfaction with their product! | |
| Test Coverage | Ideally testing is all or mostly automated, but regardless it is important to understand coverage relative to the products full code base and functionality. This can be measured for all types of testing the organization uses, commonly: Unit, Component/Integration, Regression. | |
| Efficiency & Productivity | % of time on core engineering work | Measures how much time engineers spend on design, coding and core engineering work as a % of total time. The purposes is to optimize the time spent here and manage the time on non-core engineering activities such as all-hands meetings, team meetings, training, vacation, waiting on environments issues and other potential 'hold ups' to engineering work. |
| Output for the time spent on core engineering work | Measures how much new product is actually created for the % of time actually spent coding (see above). This can be tricky to measure since there are many (non-exact science) ways to measure total output for a software product. Lines of code (KLOC - 1000's of LOC) or story points (agile terminology for a piece of functionality an engineer codes in a spint, will be many stories within one sprint normally). Since this is an approximation and far from an exact science, Eng leadership should be careful with how this metric is used and published. Also note that this metric does not measure how USEFUL the functionality is to users, just how much is produced. | |
| Security | Open vulnerabilities in production | This is an indicator of the security posture of a product or service. High priority security issues should block changes from going live. Lower priority Security vulnerabilities should be tracked and closed according to the SLA (SLA established based on estimated risk level). |
| Vulnerabilities found during testing cycles | Similar to all defects, security issues should be monitored throughout the development cycle and should gate check in and/or gate release to production for high/critical security issues. | |
| Security Incidents or Breaches | Breaches are hopefully a 'very rare to never' occurence. Breaches can also be self induced, such as sharing user data about one user to another user inadvertently. | |
| Team Engagement | Engagement scores | Formal engagement surveys provide useful and detailed input on what is working and not working from the employee's perspectives. The output is an invaluable tool for improvement but survey frequency should be managed as survey fatigue can result in inaccurate responses or lack needed details for resolution. |
| Annualized Attrition | Indicates the health of the teams' morale (also can vary based on external market factors). It is important to establish a healthy attrition level and monitor it over time. Attrition should also be benchmarked at the geographic, industry and/or company size level as the optimal attrition rate can be impacted by external factors that the organization has limited impact on. Performing exit interviews and categorizing input against themes is also a best practice. | |
| Craftsmanship | Code "Linter" Metrics | Tools in this area measure things like code complexity, code readability, correctness (may find bugs you have not found yet) as well as adherence to frameworks where desirable. Be aware that many architectural practices can't be measured directly by a tool (especially true in distributed architectures that are composed of many separately deployable services). |