
This is the second in a series of articles on Demand Management. This series is intended for those organizations operating in Tech-enabled Services. Unlike pure Software-as-a-Service, these companies follow a more traditional flow of gathering the needs of their customers and engaging their workforce to serve those needs. We’ll discuss the management of demands that extend the use of existing products or services with new features or functions as discrete programs or projects.
Demand Management describes the proactive management of work initiatives (demand) within business constraints (supply).
Remember from the first article, the Demand Management process is comprised of several stages:
- Project Intake
- Qualification of Business Value
- Quantification of effort to complete
- Prioritization
- Capacity Management
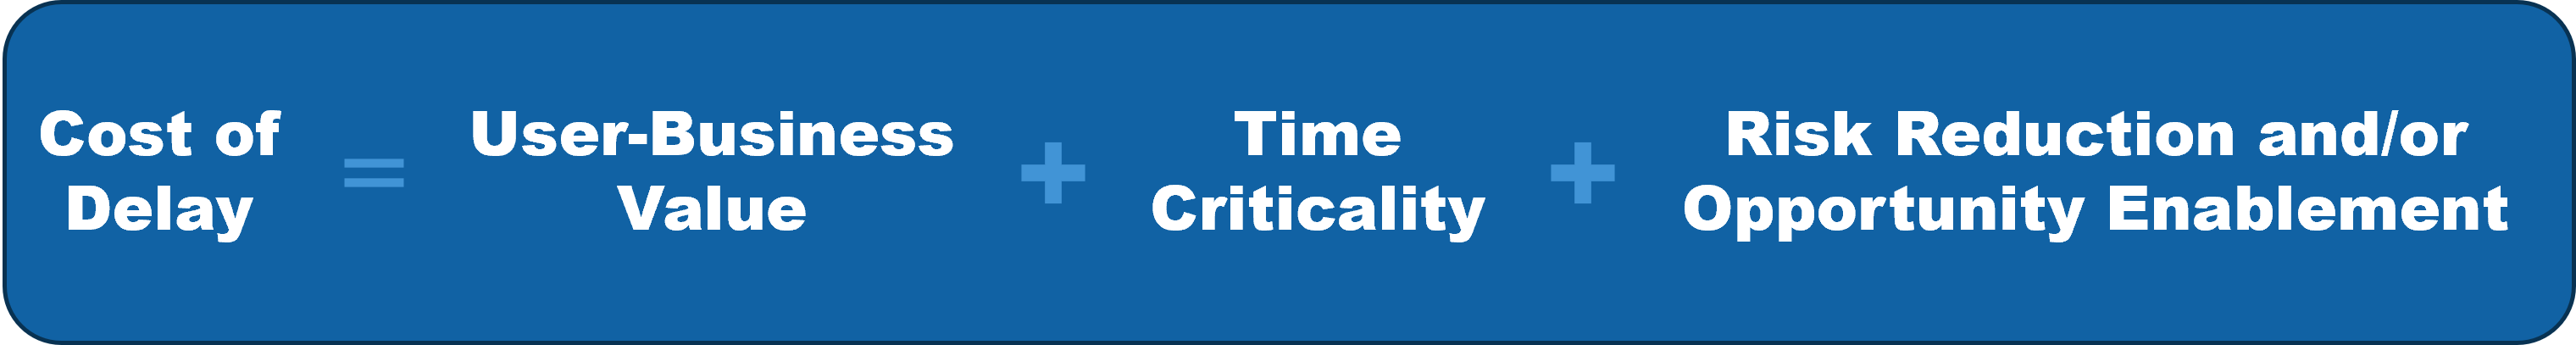
In this article, we’ll discuss in detail how companies can qualify the business value to be gained as the result of completing a project. This value is expressed in both objective measures and subjective measures. The purpose is to establish a ranked score for the business value as part of measuring the cost of delay if a project is not prioritized now.
This prioritization model builds upon the strong concept of “Weighted Shortest Job First” found in Scaled Agile for Enterprise (WSJF - Scaled Agile Framework). While AKF Partners does not promote or practice SAFe as it can become too bureaucratic for software product companies, we have found this simple WSJF calculation can be a greatly useful tool to assist in prioritization. AKF Partners extends this simple but effective concept by expanding each element of Cost of Delay with specific metric-driven rankings and a weighting factor for each element.
User-business value looks at the overall health of the business, including operational and financial metrics and any regulatory risks to the ongoing existence of the company. We also include a mechanism to quantify “executive priority” for any given initiative. Knowing that executives have a desire—properly so—to put their thumbprint on certain projects, we want to provide a means to do so but also to track how often such priority is used.
If every project is a priority, then nothing is a priority.
In general, the AKF Partner’s model ranks the impact of any element on a common scale of 1-10, 10 being the highest. Job size/Complexity is ranked using a Fibonacci scale of discrete values from 1-21 (1,2,3,5,8,13,21). We’ll address the different mechanisms—and why we use them in combination—in an article later in this series.
Revenue
Let’s begin our discussion of the Cost of Delay of any project with the reason most companies exist: revenue.
Many major initiatives will increase sales revenue for services, subscriptions, ongoing maintenance, etc. But how much? It is important to quantify the increased revenue to be expected from adding a new feature, adding a new or expanded line of business, or increasing the scalability of software to reach new geographies or markets.
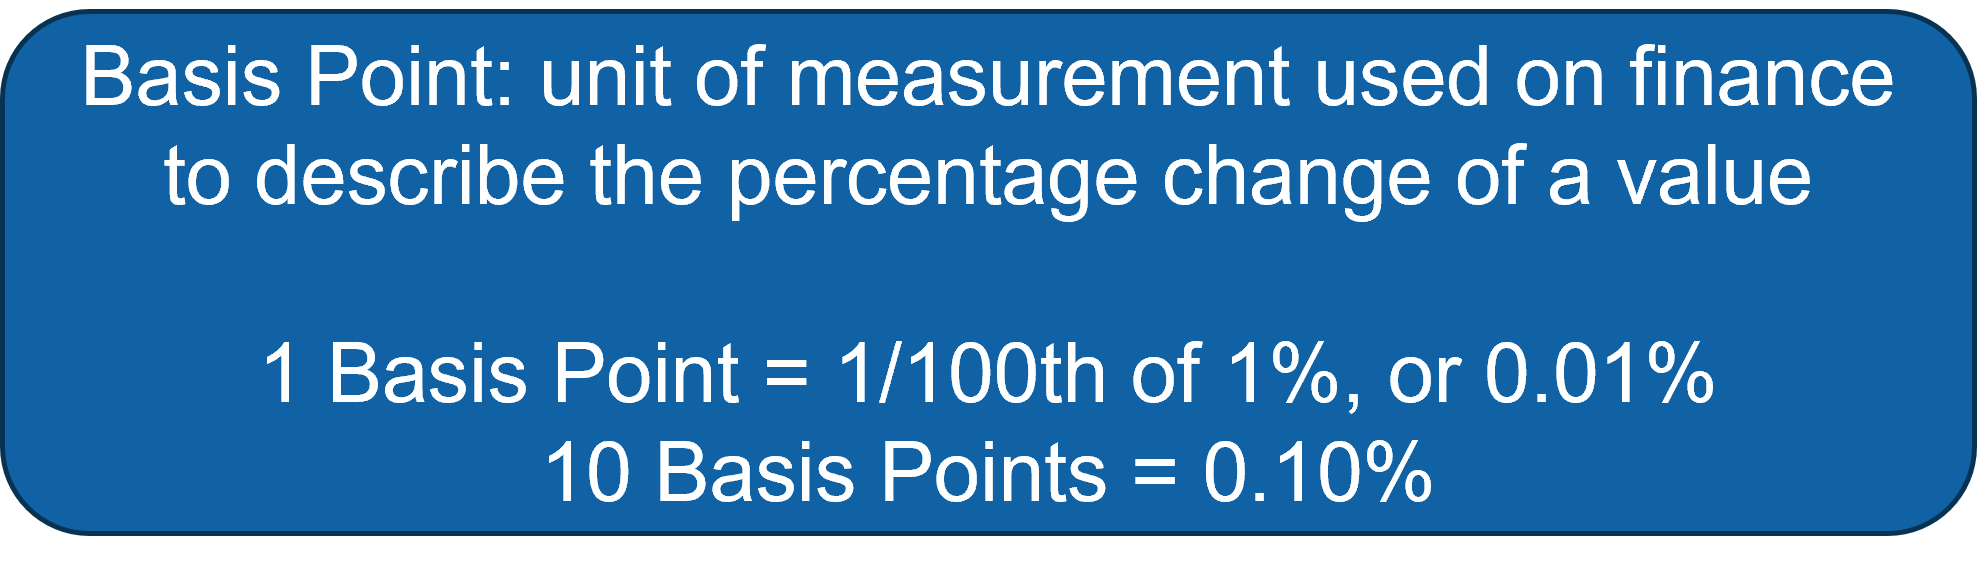
Most Sales and Finance departments are familiar with the concept of basis points, and AKF Partners uses that common term to measure the impact of increased revenue.
Assume a company has annual revenues of $200,000,000.
Question: Does this project contribute to organic revenue growth?
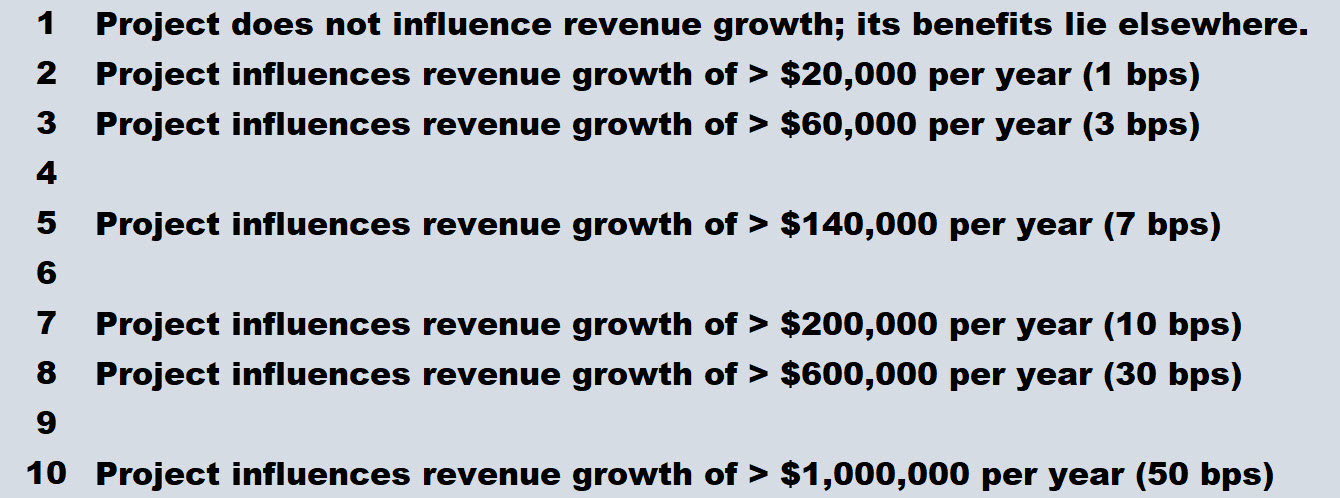
The basis points values above are examples only. Companies can best identify what increase in revenue is substantive for them. The intent is to distinctly identify the increase in revenue projected if a body of work is completed. Specifying a distinct revenue increase serves at least 2 purposes: 1) it provides a clear input to a Project Charter if something is required, and 2) it gives executives a clear measurement of accountability for the performance of the project.
We completed the work—did we get the expected results?
Gross Profit
After revenue, projects that increase gross profit via a tangible and enduring reduction of the costs to provide services are greatly valuable. This measurement is intended to be a concrete reduction in costs:
- Lower hosting costs with a cloud provider
- Reduced headcount to manage a business process
- Something else that notably reduces the cost-per-product or cost-per-service provided.
Assume a company has an annual Gross Profit of $75,000,000.
Question: Does this project contribute to an enduring increase in Gross Profit?
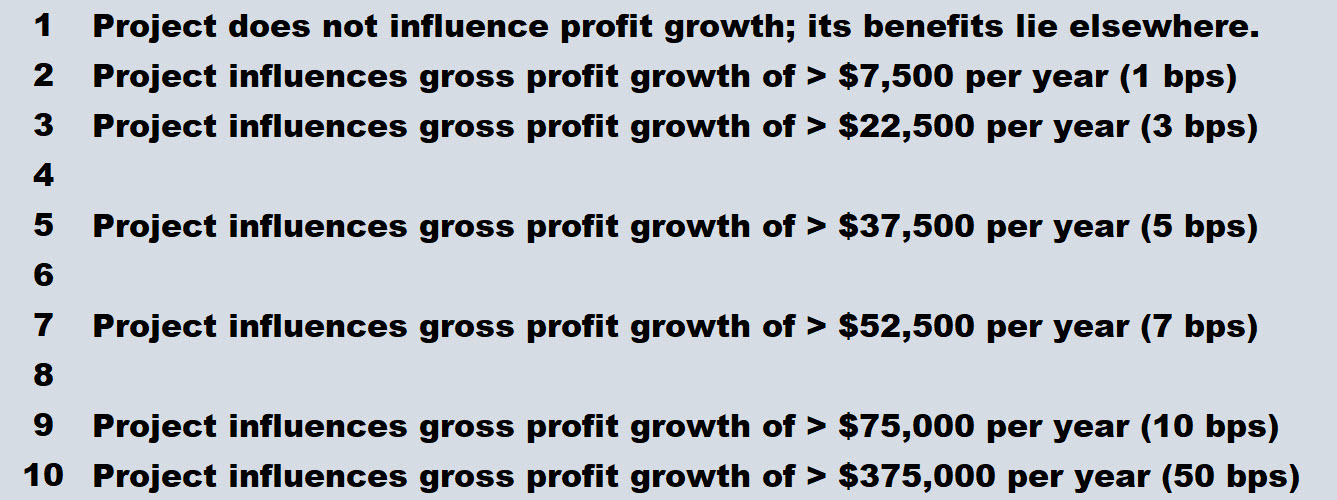
Just as with revenue, a metric on gross profit can be concretely measured at the completion of the project. Understand clearly that many things influence gross profit, and one project cannot claim victory unless its impact (or failure) is measured specifically on what costs were reduced. Your Accounting department will be most helpful in getting specific in this measurement.
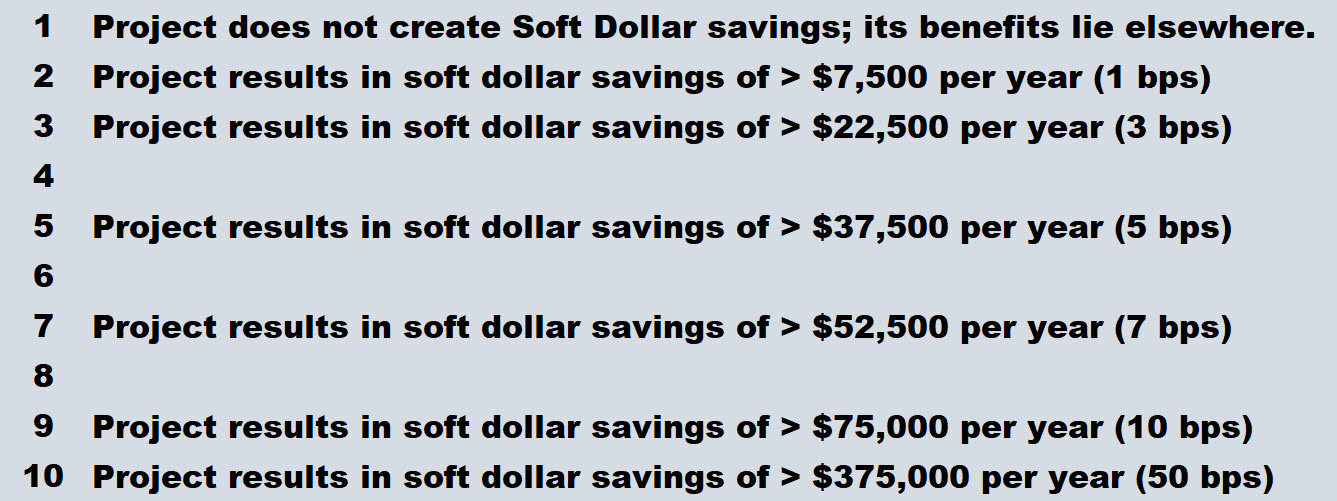
Soft Savings
Soft Savings are a bit more ambiguous than revenue or gross profit. With some simple practice and good discipline, you can clearly identify (and measure) soft savings resulting from a project. A useful way to consider this is the number of hours of labor/effort saved by someone to perform a common task. A time savings of 25% can add up very quickly, particularly if it is a common task that many people perform across a large organization.
- How many times per week does that person typically perform that task?
- What is the average time to complete the task?
- How many people in the organization (internal) or customer/user base (external) perform that same task and now save time every week?
- Make an educated guess at the hourly cost of 1 person (ask Accounting for their blended average cost).
For example, a person executes an important task 50 times per week. A process improvement saves 3 minutes every time that task is performed, saving 2.5 hours per week.
50 tasks/week, 3 minutes saved/task, 60 minutes/hour
(50*3)/60 = 2.5 hours saved per week
Let’s assume that a person earns $25 per hour. Simple math will determine how much that process improvement “saved” per year.
2.5 hours saved/week, 52 weeks per year, $25/hour
2.5*52*25 = $3,250 saved per year
Multiply that cost savings times 20 people in similar jobs, and you quickly tally a soft dollar savings of $65,000 annually. Those dollars are not really “saved” because that person is still paid their full wage, but they have 2.5 hours (50 hours across the 20 people) per week to perform other tasks. Nice work!
Those cost savings can become tangible when new headcount is not required because a process was simplified, and the existing personnel can now scale to cover more business volume. Similarly, quantify the reduction of maintenance or replacement costs for hardware that can be eliminated because of architecture efficiencies gained as the outcome of a project.
Get creative, but be specific, and be clear. Any claims for cost savings that are made to prioritize a project must be accountable after the project is complete.
Regulatory Compliance risk
We also consider risks to the health of a business, particularly if a company is in a regulated industry (e.g., banking, finance, pharmaceuticals, healthcare). Government agencies or international regulatory bodies regularly perform audits on regulated companies, and their findings and recommendations can be greatly consequential to a company’s health and welfare. Accordingly, we include this question in the overall User-Business Value consideration:
Question: Is this project a Regulatory Compliance requirement?
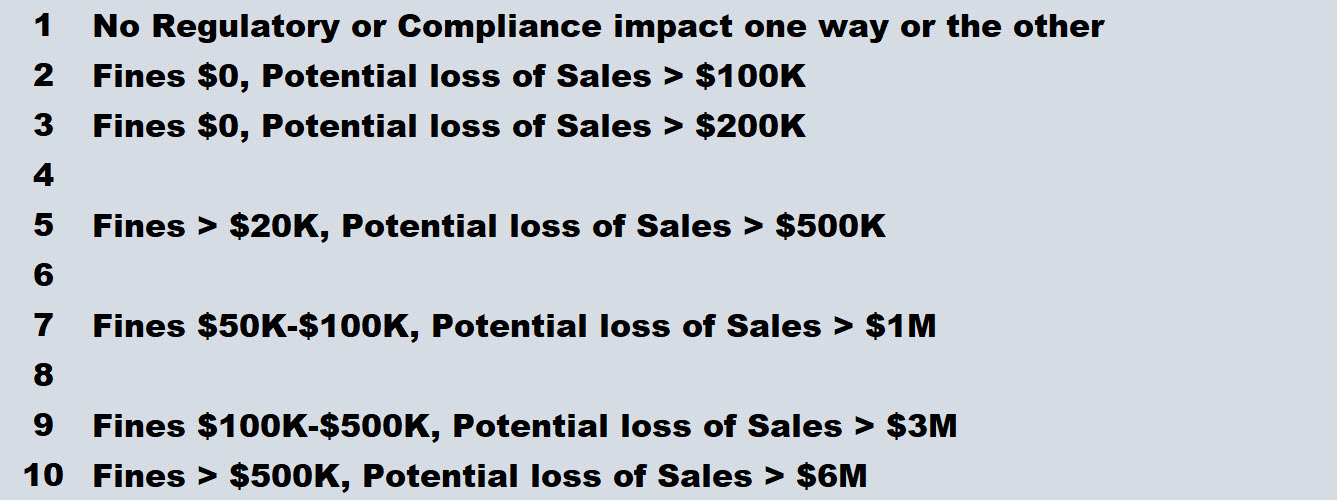
Penalties for non-compliance can result in significant fines paid to the regulatory body levying the penalty. In addition, a company's reputation under known regulatory scrutiny can be fodder for its competitors to pursue their loyal customers or potential sales. At the highest severity, a regulatory compliance issue can result in the termination of a product line, a service line, or perhaps even the shuttering of the company altogether.
Weighting the Impact of User-Business Value
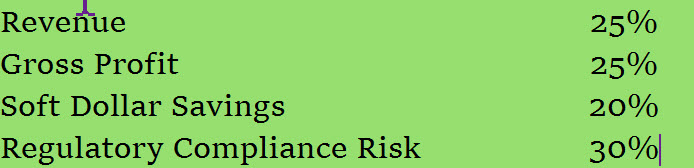
At this moment we’ll address the concept of “weighting factors” on the scoring of each element: revenue, gross profit, soft dollar savings, and risk. Not every element carries the same value to a company. For example, revenue growth may be of greater consequence to a company than increasing gross profit. Those values may change slightly over time. In general, AKF Partners applies 25% of the overall User-Business Value score to revenue, 25% to gross profit, 20% to soft dollar savings, and 30% to Regulatory Compliance. Decide those weighting factors for your company.
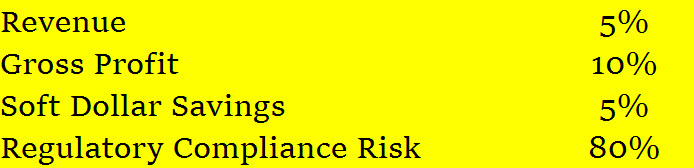
Because regulatory compliance can have an out-sized impact on the priority of certain projects, AKF Partners applies a sliding scale to the weighting factors for projects that score high on regulatory.
- For projects with a regulatory score of “8” the weighting factor for Regulatory increases from 30% to 80%. Each of the other elements decrease in importance (revenue to 5%, gross profit to 10%, soft savings to 5%).
- For projects with a regulatory score of “10”, potentially catastrophic risk, the weighting factor for Regulatory shifts to 100%, and all other elements fall to 0%.

If a company is subject to an untimely end due to a regulatory compliance issue, and a KEY project is essential to solving that issue, no other factor matters.
Executive Priority
The final element for User-Business Value is Executive Priority. Certain projects hold special significance for business executives. It may be a primary reason a CEO is hired to turn around an organization, a particular point of passion for a CFO, or a board-level initiative being chaired by the COO.
We seek to measure the level of attention given to any specific project. The impact of an Executive Priority is to artificially increase the weighting factor for the overall User-Business Value score.
- For scores 5-6, the UBV weight increases by 25% to 125%.
- For a scores 7-8, the UBV weight increases by 35% to 135%.
- For score of 9 the UBV increases by 50% to 150%.
- For a max score of 10, the UBV is doubled to 200%.
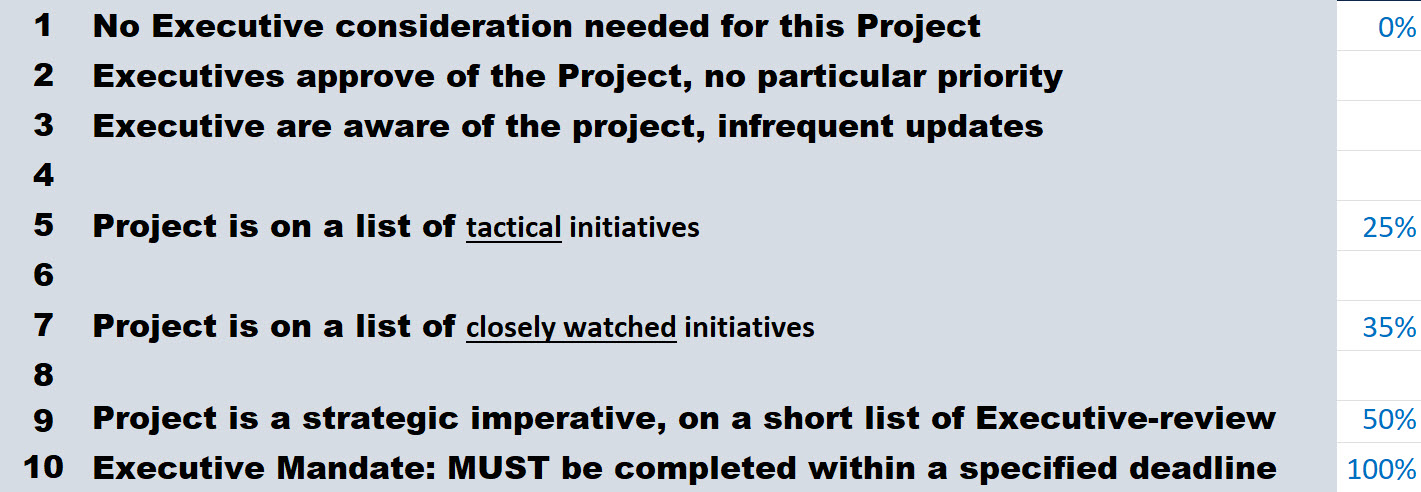
This effectively increases the value in the numerator of the WSJF calculation, and increases the ranked score for the project. A key reason we explicitly capture how important a project is to executives is that we intend to track how frequently Executive Priority is used in order to discourage it from being overly used/abused.

We encourage you to take what you’ve read in this article and start a conversation in your organization. How would you quantify the User-Business Value for your company? Are there additional factors you consider important within your industry that we have not mentioned here? How would you dimension those factors to distinguish a score of 5 from a score of 8, or 10? What weights would you apply to the elements you measure?
Next we’ll consider the Time Criticality of each project, and the Risk Avoidance or Opportunity Enablement that each project brings. Stay tuned for Next article From AKF Partners.