Recently, we have come across many teams that are not using story points and team velocity to track progress through the sprint.
When asked why, we hear things like: "It doesn't really work", "We have too many P1 issues", or "we trust each other and work hard on the next most important thing."
Have you heard this? Does it resonate with you? So, ... how do they know it is the right thing they are working on? How do they know the team is not distracted on other side projects or priorities? How do they know the team is "doing it's best?" How does the company accurately communicate with customers about upcoming releases and features?
Spoiler alert, story points and velocity are important tools because they provide an effective way to communicate the engineering team's progress on their commitments. This is about trust, performance, and improvement. Your team needs to be doing this.
Let's review why these tools are so important and how they relate to the goals of a company.
A review of goals, objectives, key performance, leading, and lagging indicators
When an engineering team performs work, there is a cost associated with the work. Both the cost of hiring and managing the team and the opportunity cost of not doing something else need consideration.
For technical products, it should be the case that the company has a meaningful product they want to get in the hands of customers. If customers use the product, it should provide value back to the company and stakeholders. As time goes on, the Product team anticipates what the customers needs and the product will morph to reflect the true needs of the customer.
To achieve this, best practices suggest measurements and monitoring to make sure the team's effort focuses on the right thing.
Objectives and Outcomes
Let's start with some definitions from Merriam-Webster
- Objectives: Something toward which effort is directed: an aim, goal, or end of action. a strategic position to be attained or a purpose to be achieved [by a military operation]
- Outcome: something that follows as a result or consequence
For our case, either one of these will work. We are looking for the end result. The place we want to be at, the situation we want to be in. This is the goal.
These are high level visionary ideas and often harder to measure. Some notable objectives in history include:
- The everything store - Amazon
- 1 Billion View hours - YouTube
- Make humans an interplanetary species - SpaceX
These are awesome, big hairy audacious goals (BHAGs). Unfortunately, while ideas are cool, it is the execution towards the goal that makes the difference. So, there are other measurement tools to help monitor the execution of the idea.
Key Performance Indicators (KPIs)
There is an endless discourse on the internet about KPIs. For more discussion see here, here, and here. For our purpose:
KPIs measure progress towards a goal
I have a friend who told me he hated big goals because you have no control of them. He also said he wanted to track day to day things that he had control over. Well, like onions and ogres, goals have layers too. This leads us to leading and lagging indicators.
Leading and Lagging indicators
Usually the progress we want to measure occurs some time after the action we take to achieve it, sometimes it is long after the action.
- Lagging indicators are the measurements that we see after time.
- Leading indicators are the measurements of activities that we predict will give us the outcome we want.
Lead indicators are the magic sauce that empower daily excellence towards a goal.
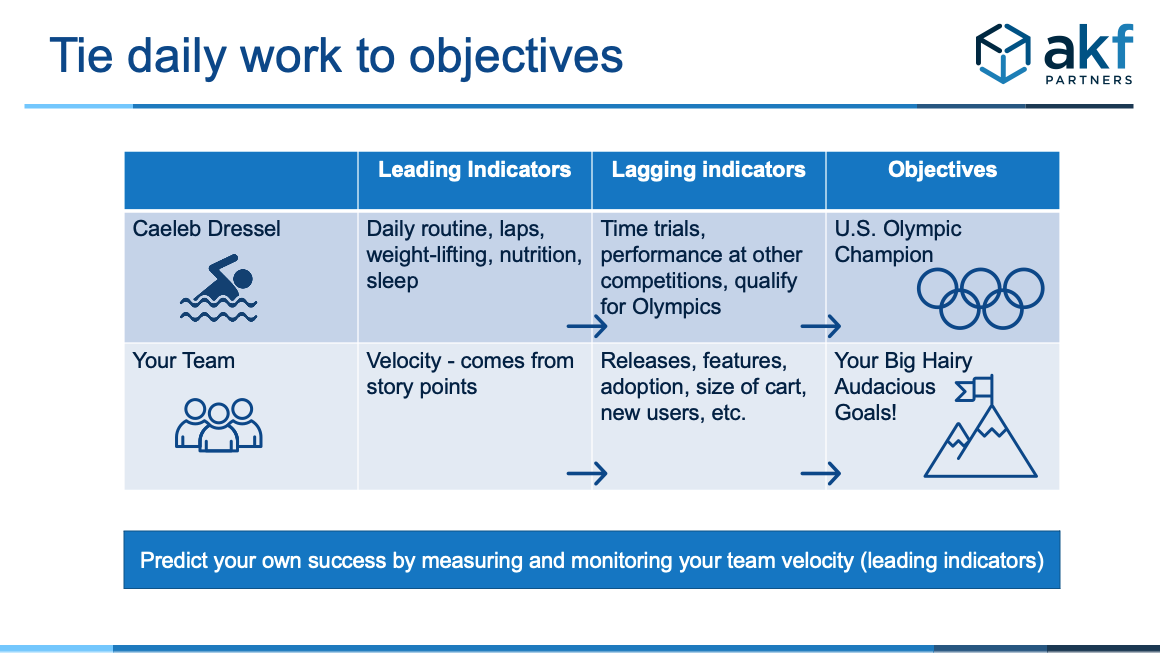
In the context of leading and lagging indicators, consider this story. In the 2020 Tokyo Olympics, Caeleb Dressel won 5 gold medals for the US. Before he became an Olympic champion he had to take some actions that he expected would get him to his goal. He had to qualify for the team, he had to swim fast. But these are still the lagging indicators.
The leading indicators were things like his daily exercise routine, the laps he swam every day, the starts he practiced, the time in the weight room. All the daily work.
In technology products, story pointing and velocity measurents, are the lead indicators. Each day your team should be able to look at an accurate burndown chart that shows exactly where things stand. This allows the company to better predict the progress and manage the expectations of the product.
These tools are also used to help the team make measurable steps of improvement. In retrospectives they can discuss what is impededing their velocity or their ability to complete stories. There are a litany of reasons velocity slows, including: issues with how the stories are defined, the QA process, the deployments, interruptions, competing priorities.
Companies may get a sense that things are "off" or the team could "do better". But, without some measurement they will have a hard time solving the challenges they face. It will be an uphill battle to communicate, take action, and know that the action had the desired effect.
Velocity and story pointing help this by making progress and expectations clear.
Do the work and measure your day to day activities!
Things to remember
Velocity is not a management tool. Do not use it to set a quota against or inflate it. It is the team's tool for communication and tracking their own work.
Story points need to be relative to each other, not time-based. A story should be the same "size" independent on who is working on it. We size them in relation to other stories.
Resist the urge to track time on stories as a way to calculate the actual cost to create a feature. Instead track the stories in an epic and use the average velocity while the team worked on that epic to track the cost of the Epic. This will give you a sense of the project cost.
Do not normalize stories or velocity across teams. Stories and velocity have meaning within a team. Different teams have different ways they consider stories and relative velocities. Let this be. Keep the process the same, but the specific metrics will be the same
Story points and velocity do matter
The day to day activities matter. Story points and velocity matter. Measurements matter
Imagine setting a goal to lose 30 lbs, but not watching what you eat, how much you exercise, how much water you drink, or how well you sleep. Then you stand on the scale and wonder why you aren't seeing the change you were hoping for.
It is the same thing with an engineering team that doesn't measure and monitor their own work. The team needs some way to track their day to day progress.
Does this sound familiar? If you need help getting your team to good story sizing, and an effective velocity, we at AKF Partners have been in your shoes and we know how to help. Contact us.